
Source Description:
Dimensions for the TheraSeed are as reported by Monroe and Williamson 1. The TheraSeed consists of two cylindrical graphite pellets coated with radioactive palladium and separated by a cylindrical lead marker. The graphite cylinders have a diameter of 0.560 mm and length of 0.890 mm. The lead marker is 1.09 mm long and 0.51 mm in diameter (Note: v1 of this databse mistakenly reported the diameter as 0.50 mm). The thickness of Pd on the graphite surface is 2.20 μm for the "light seed", and 10.50 μm for the "heavy seed"1, 2. Encapsulation for the TheraSeed is a thin titanium tube that has an outer diameter of 0.826 mm with wall thickness of 0.0560 mm. The ends are sealed with two titanium end cups that are 0.040 mm thick. The end cups are composed of a 0.334 mm long hollow cylindrical section attached to a hemi-spherical shell. Both the cylindrical section and hemi-spherical shell have inner radii of 0.306 mm. There are small changes in the dose-rate constant (<0.03%) and radial dose function (<0.2%) when using either air or water to fill the empty hole portion of the "light" source endcaps. However, the corresponding changes for anisotropy functions close to the "light" source endcaps (0°<θ<20° and r<1 cm) ranged from 1% to 8%. Compared to the "heavy source", the "light source" radial dose function shows average changes of 2.5% (ranging from -1% to 9%) very close to the source (ie, 0.05 to 0.1 cm) and about -3% (ranging from 0% to -10%) for far distances (ie, 0.1 to 10.0 cm). The calculated anisothropy functions for the "heavy source" are a little smaller than for the "light source" at close distances and proximal angles to the source with differences ranging from 1% to 28%. Also, the dose-rate constant for the "heavy source" shows a slightly higher value (~0.87%) than the "light source". The overall source length is 4.50 mm and the active length is 4.23 mm calculated using the TG-43 effective line source length approximation. The maximum displacement of one of the cylindrical sources is 0.20 mm along the seed axis and 0.075 mm in the radial direction. (Note: The V1 database only reported the data for light seed). The mean photon energy calculated on the surface of the source is 20.51 for the "Light source" and 20.55 keV for the "heavy source" with mean statistical uncertainties < 0.01%. It is of note that presently only the "light source" is available in the market.
Dose-Rate Constant - Λ :
Dose-rate constants, Λ , are calculated by dividing the dose to water per history in a (0.1 mm)3 voxel centered on the reference position, (1 cm,Π/2), in the 30x30x30 cm3 water phantom, by the air-kerma strength per history (scored in vacuo). As described in ref. 3 , dose-rate constants are provided for air-kerma strength calculated using voxels of 2.66x2.66x0.05 cm3 (WAFAC) and 0.1x0.1x0.05 cm3 (point) located 10 cm from the source. The larger voxel size averages the air-kerma per history over a region covering roughly the same solid angle subtended by the primary collimator of the WAFAC 4,5 at NIST used for calibrating low-energy brachytherapy sources and is likely the most clinically relevant value. The small voxel serves to estimate the air kerma per history at a point on the transverse axis and includes a small 1/r2 correction (0.5%) 3. MC uncertainties are only statistical uncertainties (k=1).
| Author | Method | Λ (cGy h-1 U-1) | Abs. Uncertainty |
| Safigholi et al 6 | WAFAC "Light source" | 0.6834 | 0.0001 |
| Safigholi et al 6 | Point "Light source" | 0.7583 | 0.0018 |
| Safigholi et al 6 | WAFAC "Heavy source" | 0.6894 | 0.0001 |
| Safigholi et al 6 | Point "Heavy source" | 0.734 | 0.0020 |
| Taylor, Rogers 3 | WAFAC "light source" | 0.694 | 0.002 |
| Taylor, Rogers 3 | Point "Light source" | 0.772 | 0.003 |
| Williamson 2 | WAFAC (PTRAN) "Light source" | 0.688 | |
| Williamson 2 | WAFAC (PTRAN) "Heavy source" | 0.694 | |
| Monroe, Williamson 1 | WAFAC (PTRAN) "Light source" | 0.691 | 0.02 |
| Monroe, Williamson 1 | WAFAC (PTRAN) "Heavy source" | 0.694 | 0.02 |
| Chiu Tsao et al 7 | TLD (Solid Water) | 0.680 | --- |
| Nath et al 8 | TLD (Solid Water) | 0.650 | 0.05 |
| Rodriguez, Rogers 9 | TLD (Revised Nath) | 0.653 | 0.051 |
| Rodriguez, Rogers 10 | WAFAC (BrachyDose) | 0.685* | 0.015 |
| Rivard et al 11 | TG-43U1 Consensus Value | 0.686 | --- |
* Rodrigeuz-Rogers10 value are different from Taylor-Rogers due to some geomtery corrections with BrachyDose
Radial dose function - g(r):
The radial dose function, g(r), is calculated using both line and point source geometry functions for both "light" and "heavy" sources and tabulated at 36 different radial distances ranging from 0.05 cm to 10 cm. Fit parameters for a modified polynomial expression are also provided 12 . The mean residual deviations from the actual data for the best fit were < 0.2%.
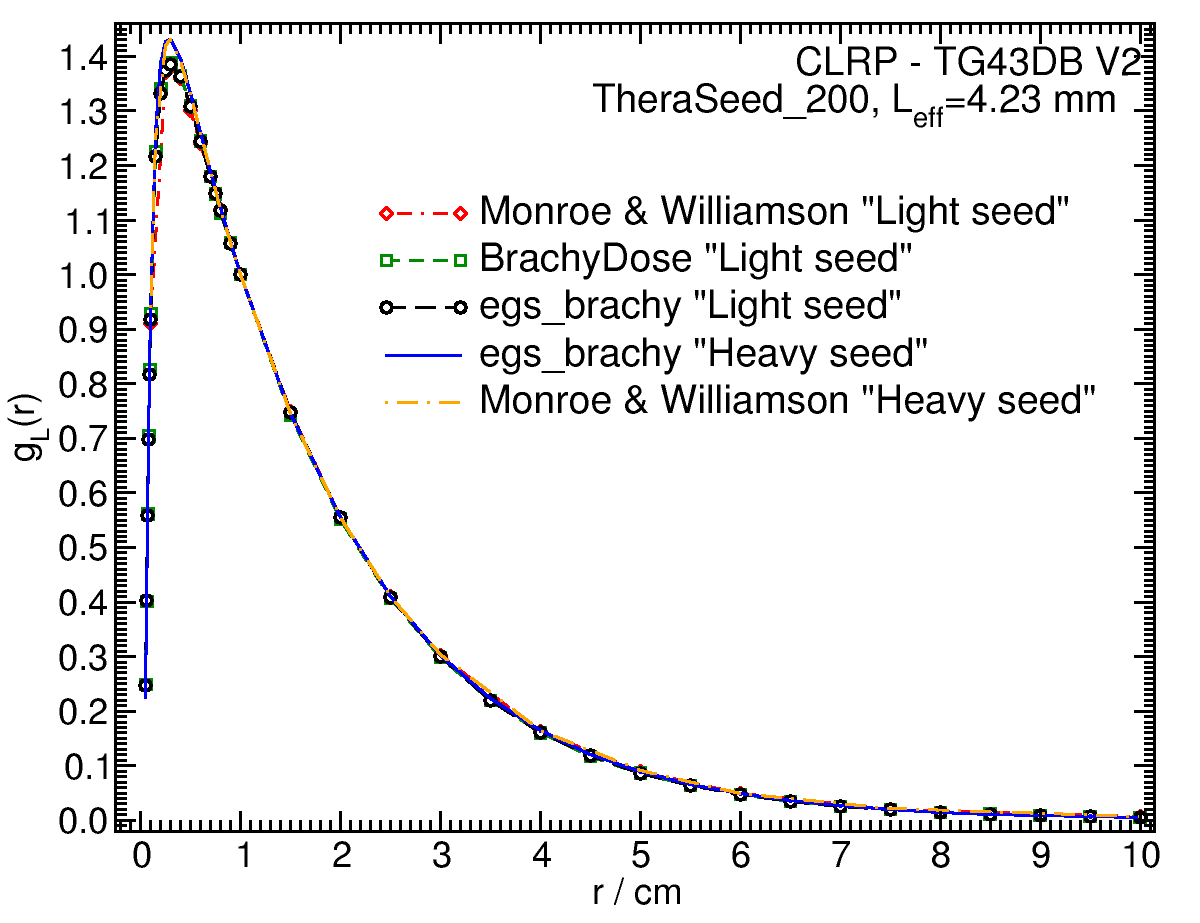
| Fitting coefficients for g L (r) = (a0 r-2 + a1 r-1 + a2 + a3r + a4r2 + a5 r3) e-a6r "Light source" | |||
| Fit range | Coefficients | ||
| r min (cm) | r max (cm) | ||
| 0.1 | 10.0 | a0 / cm2 | (-2.70+/-0.10)E-03 |
| a1 / cm | (-6.76+/-0.12)E-02 | ||
| a2 | (1.912+/-0.004)E+00 | ||
| a3 / cm-1 | (-1.45+/-0.17)E-01 | ||
| a4 / cm-2 | (-3.4+/-2.0)E-03 | ||
| a5 / cm-3 | (8.0+/-1.0)E-04 | ||
| a6 / cm-1 | (5.25+/-0.07)E-01 | ||
Anisotropy function - F(r,θ):
Anisotropy functions are calculated using the line source approximation for both "light" and "heavy" sources and tabulated at radii of 0.1, 0.15, 0.25, 0.5, 0.75, 1, 2, 3, 4, 5, 7.5 and 10 cm and 32 unique polar angles with a minimum resolution of 5° . The anisotropy factor, φan (r), was calculated by integrating the solid angle weighted dose rate over 0° ≤ ϑ ≤ 90° .
F(0.25,θ) 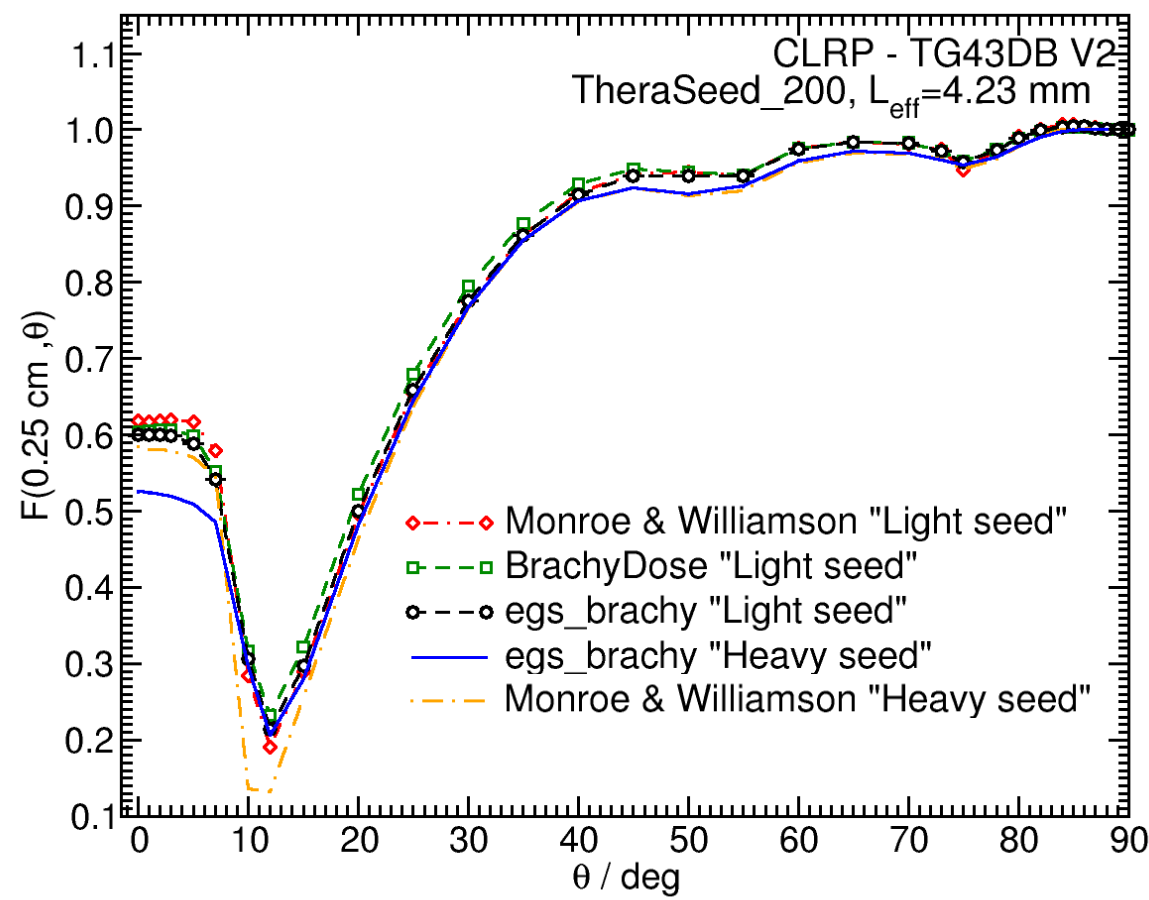 |
F(0.50,θ)  |
F(1.00,θ) 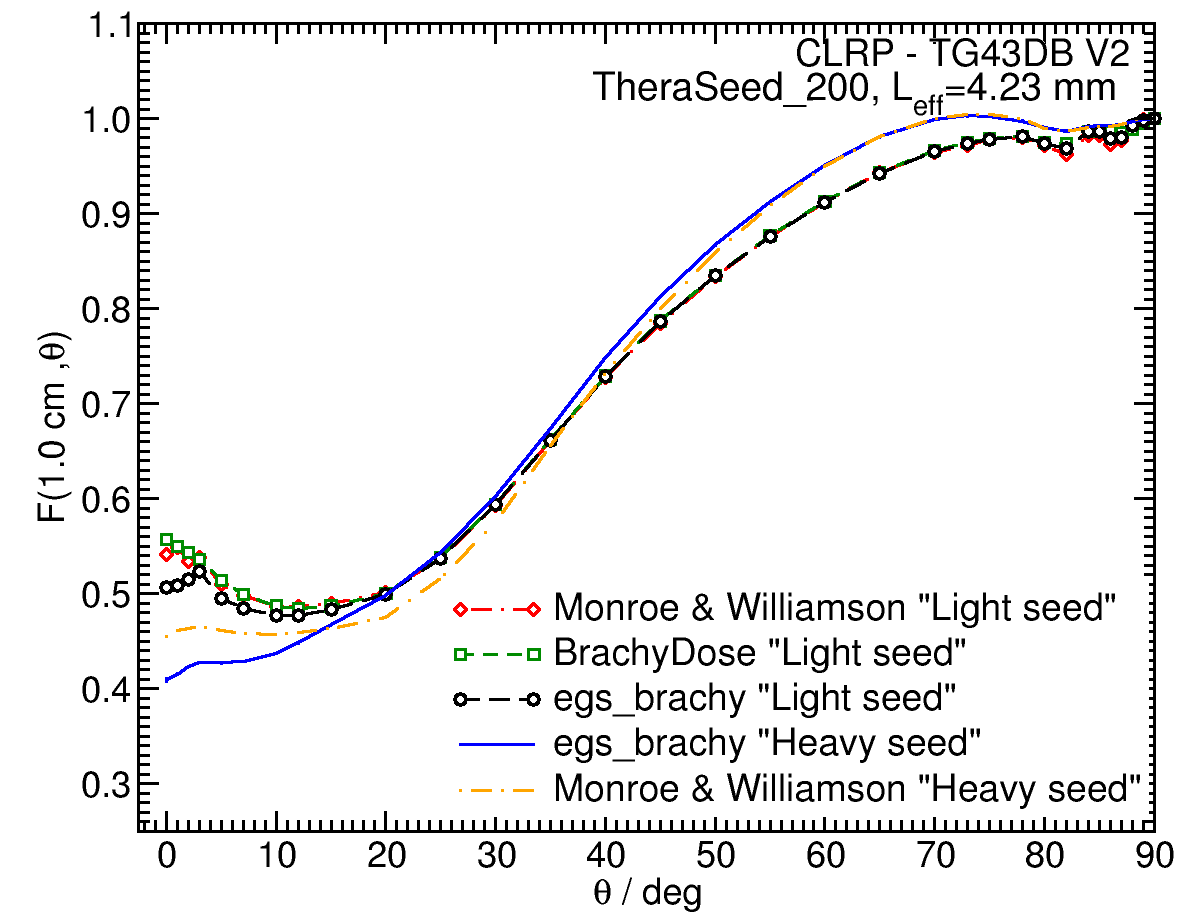 |
F(5.00,θ) 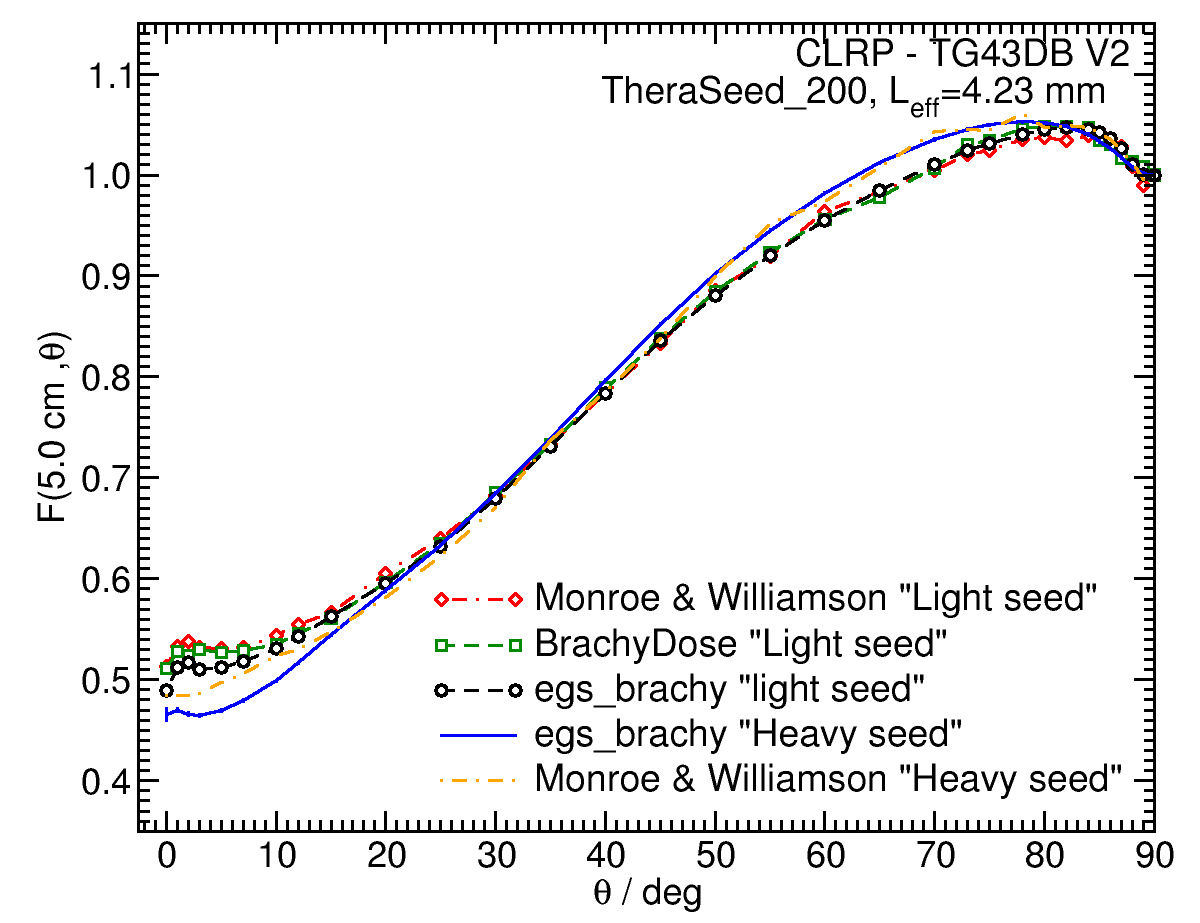 |
F(7.50,θ) 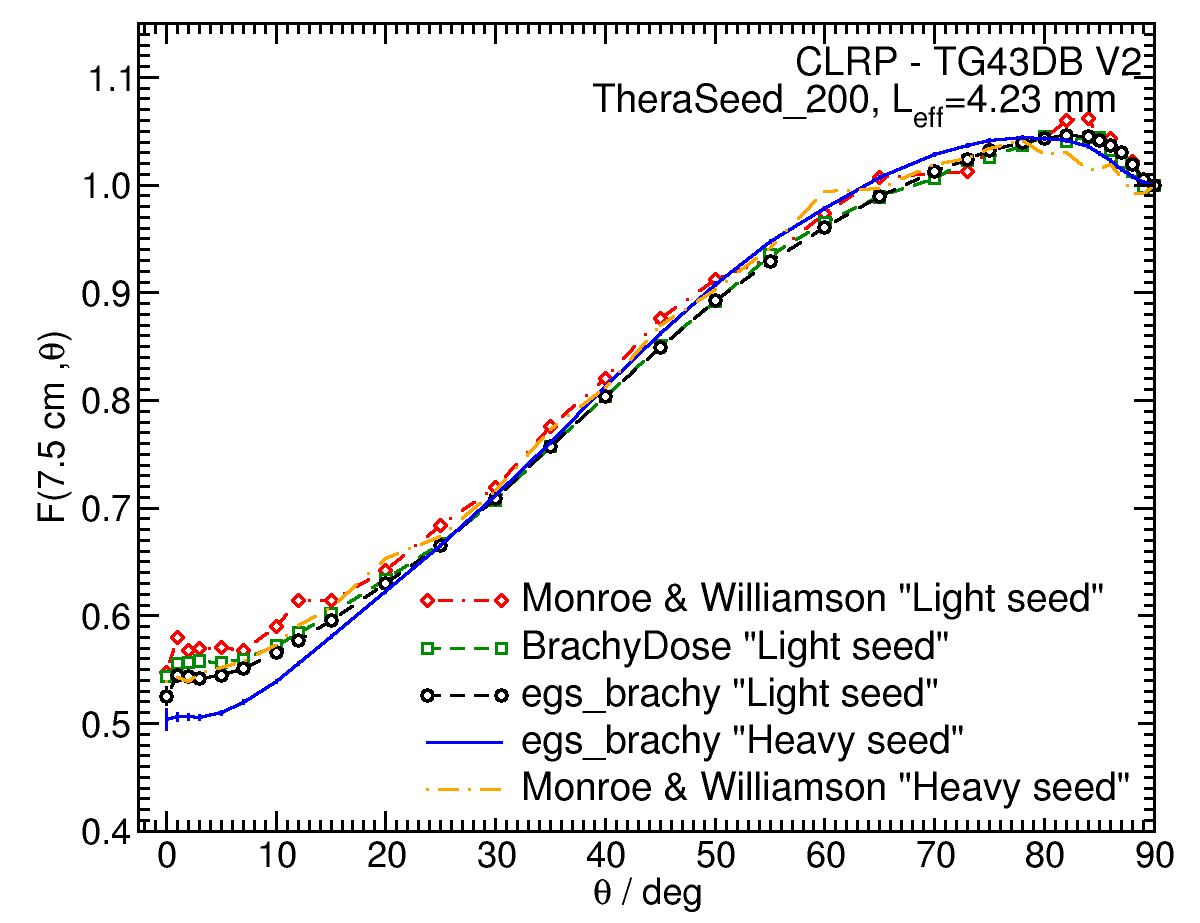 |
Primary and Scatter Separated (PSS) Dose Data: D ii (r,θ):
Primary and Scatter Separated (PSS) dose data (for light source) are tabulated at 24 radii from 0.1 cm to 10 cm and 24 unique polar angles with a minimum resolution of 5 o for light source. High resolution (Δr = 1 mm, ΔΘ = 1 o ) primary scatter dose data are also available in .csv files. For the purposes of these calculations, scatter within the source is not considered as scattered and any photon escaping the source encapsulation is considered a primary. Only photons which scatter within the phantom are counted in the scatter tallies. Doses are normalized to the total photon energy escaping the encapsulation.
High resolution (1mm/1°) Tabulated D ii (r,θ) data in .csv format: Zipped archive
D ii (r,90°)*r 2 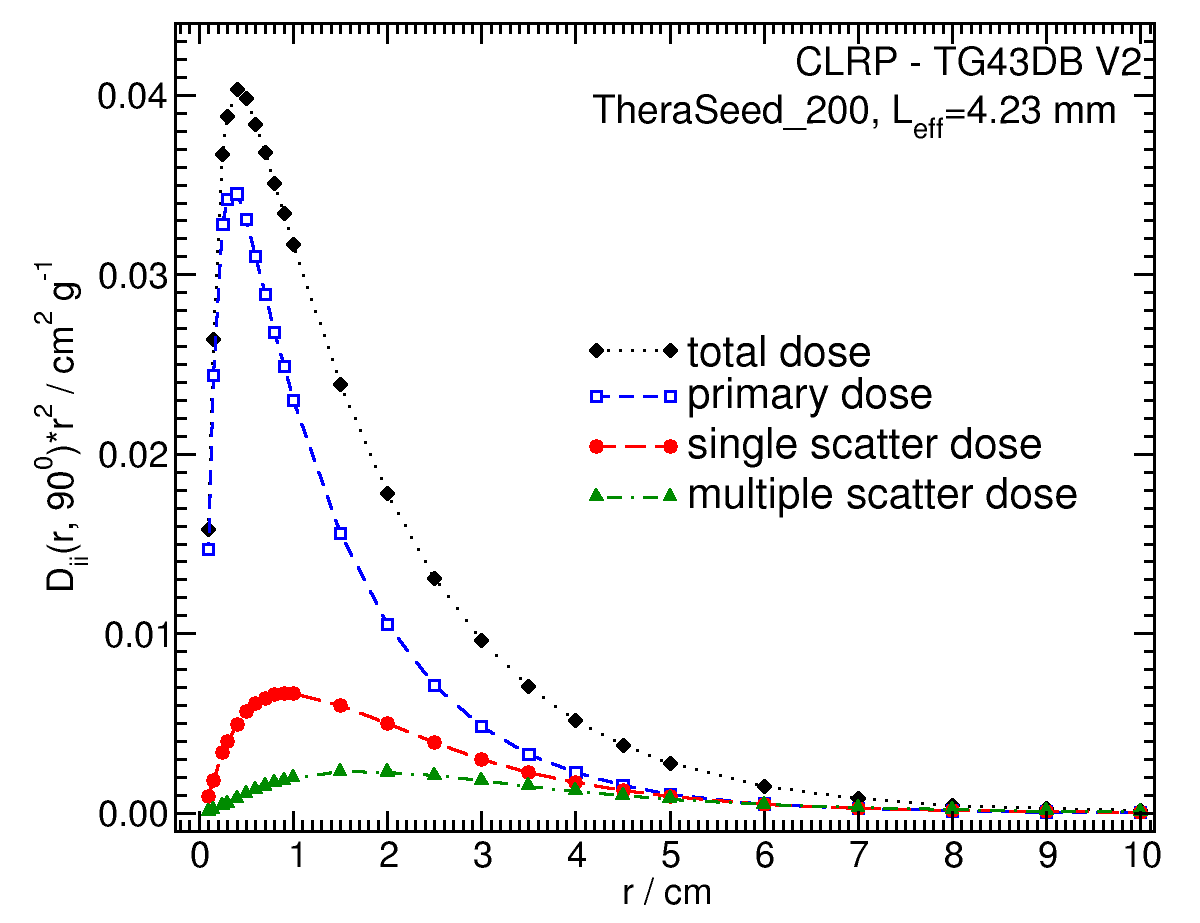 |
D ii (1.00,θ) 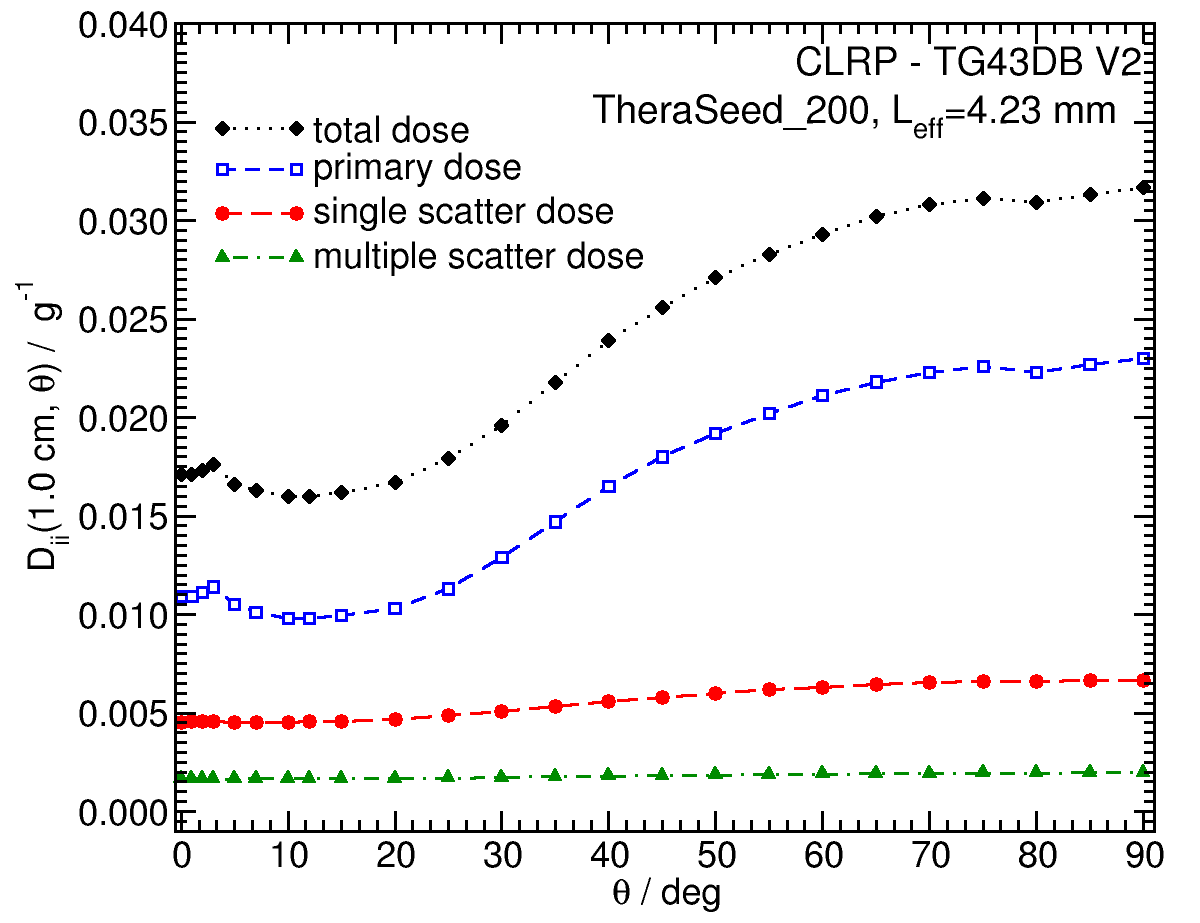 |
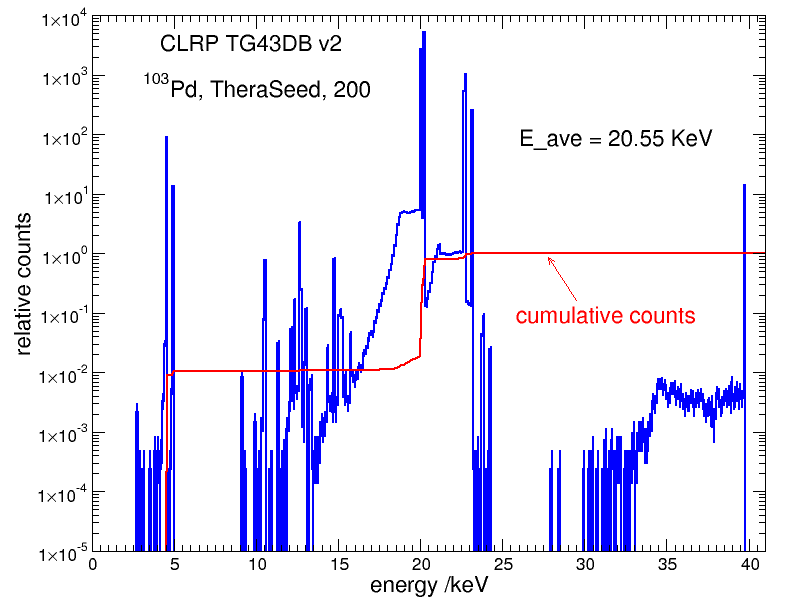
Photon Energy Spectra
Photon energy spectra generated by the source model is calculated using egs_brachy surface count scoring option to get the spectrum on the surface of the source. The relative counts here is the counts per 0.1 keV bin per MeV normalized to 1 count per MeV-1. The MC calculations have a statistical uncertainty less than 0.0.01% on the mean energy. The spectrum data are available in xmgrace format below.
Energy weighted photon spectrum data: xmgrace
References:
1. J. I. Monroe, J. F. Williamson, Monte Carlo-aided dosimetry of the Theragenics TheraSeed Model 200 103Pd interstitial brachytherapy seed, Med. Phys., 29 , 609 - 621, 2002
2. J. F. Williamson, Monte Carlo modeling of the transverse-axis dose distribution of the Model 200 103Pd interstitial brachytherapy source, Med. Phys., 27, 643-654, 2000.
3. R. E. P. Taylor, D. W. O. Rogers, An EGSnrc Monte Carlo-calculated database of TG-43 parameters, Med. Phys., 35 , 4228-4241, 2008
4. R. Loevinger, Wide-angle free-air chamber for calibration of low--energy brachytherapy sources, Med. Phys., 20 , 907, 1993.
5. S. M Seltzer et al , New National Air-Kerma-Strength Standards for 125I and 103Pd Brachytherapy Seeds, J. Res. Natl. Inst. Stand. Technol. ,108,337358,2003.
6. H. Safigholi, M. J. P. Chamberland, R. E. P. Taylor, C. H. Allen, M. P. Martinov, D. W. O. Rogers, and R. M. Thomson, Update of the Carleton Laboratory for Radiotherapy Physics (CLRP) TG-43 parameter database for brachytherapy, to be published (Current calculation). 7. S Chi-Tsao, L. L. Anderson, Thermoluminescent dosimetry for 103Pd seeds (model 200) in solid water phantom , Med. Phys., 18 , 449 - 452,1991.
8. R. Nath et al , Measurement of dose-rate constant for 103Pd seeds with air kerma strength calibration based upon a primary national standard, Med. Phys., 27 , 655 - 658 , 2000. 9. M. Rodriguez , D. W. O. Rogers, Effect of improved TLD dosimetry on the determination of dose rate constants for 125I and 103Pd brachytherapyseeds,Med.Phys.41, 114301-15, 2014. 10. M. Rodriguez, D. W. O. Rogers, On determining dose rate constants spectroscopically, Med. Phys. 40 , 011713-10, 2013. 11. M. J. Rivard et al , Update of AAPM Task Group No. 43 Report: A revised AAPM protocol for brachytherapy dose calculations, Med. Phys., 31 , 633 - 674, 2004.
12. R. E. P. Taylor, D. W. O. Rogers, More accurate fitting of 125I and 103Pd radial dose functions, Med. Phys., 35 , 4242--4250, 2008.