![]()
Source Description:
The dimensions for the CT50 CivaThin 1,2 are taken from the studies by Rivard 1 and Reed et al 2. The CivaThin family sources are available in lengths of 10, 20, 30, 40, and 50 mm, and referred to as CT10 to CT50, respectively. The CivaThin sources are identical to the CivaString sources, except their outer diameter is a little smaller. Encapsulation for the CT50 CivaThin source is made of organic polymer material with a mass density of 1.15 g/cm3 and weight fractions of 8.5%, 64.8%, 5.0%, and 21.7%, of H, C, N, and O, respectively. The outer diameter of the source is 0.060 mm. The ends are sealed as a solid cylinder (diameter 0.060 mm). The CT50 source consist of five cylindrical Au markers with a diameter of 0.250 mm and a length of 0.80 mm. They are off center at 0.0 mm, ± 1.0 mm, and ± 2.0 mm, along the length of the source with a 0.0550 mm offset between the cylindrical axis of the Au markers and the cylindrical axis of the organic polymer. Overall CT50 sources include twenty Pd regions. Two 103Pd regions are located on either side of each Au marker (overall twenty regions) centered at longitudinal distances of ± 0.167 mm, ± 0.389 mm, ± 0.611 mm, ± 0.833 mm, ± 1.167 mm, ± 1.389 mm, ± 1.611 mm, and ± 1.833 mm, ± 2.167 mm, ± 2.389 mm offset from the source center. Each well is simulated similar to an isoceles trapezoidal prism with long and short bases of lengths 2.10 mm and 1.940 mm, and a height and a width of 0.250 mm and 0.280 mm, respectively. Each region has a rectangular cross section, and there is a 0.0350 mm distance between the longitudinal axis of each well and central axis of the organic polymer. Each Pd region are modeled with 5% weight fractions of natural Pd (~8 μg of Pd) and 95% of organic polymer (H=0.08075, C=0.6156, N=0.0475, O=0.20615, Pd=0.05), respectively. The Au markers and each well are fixed in organic polymer encapsulation without any air space. The overall source length is 50.90 mm and the active length is 50.0 mm. The mean photon energy calculated on the surface of the source is 20.58 keV with mean statistical uncertainties < 0.01% .
Dose-Rate Constant - Λ :
Dose-rate constants, Λ , are calculated by dividing the dose to water per history in a (0.1 mm)3 voxel centered at the reference position, (1 cm,Π/2), in the 30x30x30 cm3 water phantom, by the air-kerma strength per history (scored in vacuo). Paxton et al 3 show that, for geometrical reasons, the NIST WAFAC cannot directly measure the air-kerma strength for long sources (> 1 cm) because some photons would create charge outside the charge collecting region. Assuming WAFAC or VAFAC measurements deliver the air-kerma averaged over their front surface, kr2 corrections are necessary to convert the average kerma on the WAFAC detector’s front surface to the kerma on the axis, as required for determining the air-kerma strength. We have determined kr2 corrections by calculating the average kerma per history in a thin (0.001 cm) circular (radius = 1.333 cm) WAFAC detector (equivalent area to a WAFAC voxel volume of 2.363x2.363x0.001 cm3) located at 10 cm from the axis for a series of point sources off-axis and comparing to the kerma per history in a small point voxel (0.1x0.1x0.001 cm3) on the axis. The detector covered the same solid angle as the NIST WAFAC 4, 5 or UW VAFAC 3 detectors at 30 cm. The values of kr2 for line detectors is then determined by integrating the corrections as a function of the point source distance off-axis. The values calculated are 1.0094,1.0092, 1.0090, 1.0086, and 1.0084 for a point source and 1 cm, 2 cm, 4 cm, 5 cm line sources. These values are comparable with the analytic value of 1.0094 (square detector) or 1.0090 (circular detector) for a point source on axis 6 . MC uncertainties are statistical uncertainties only (k=1).
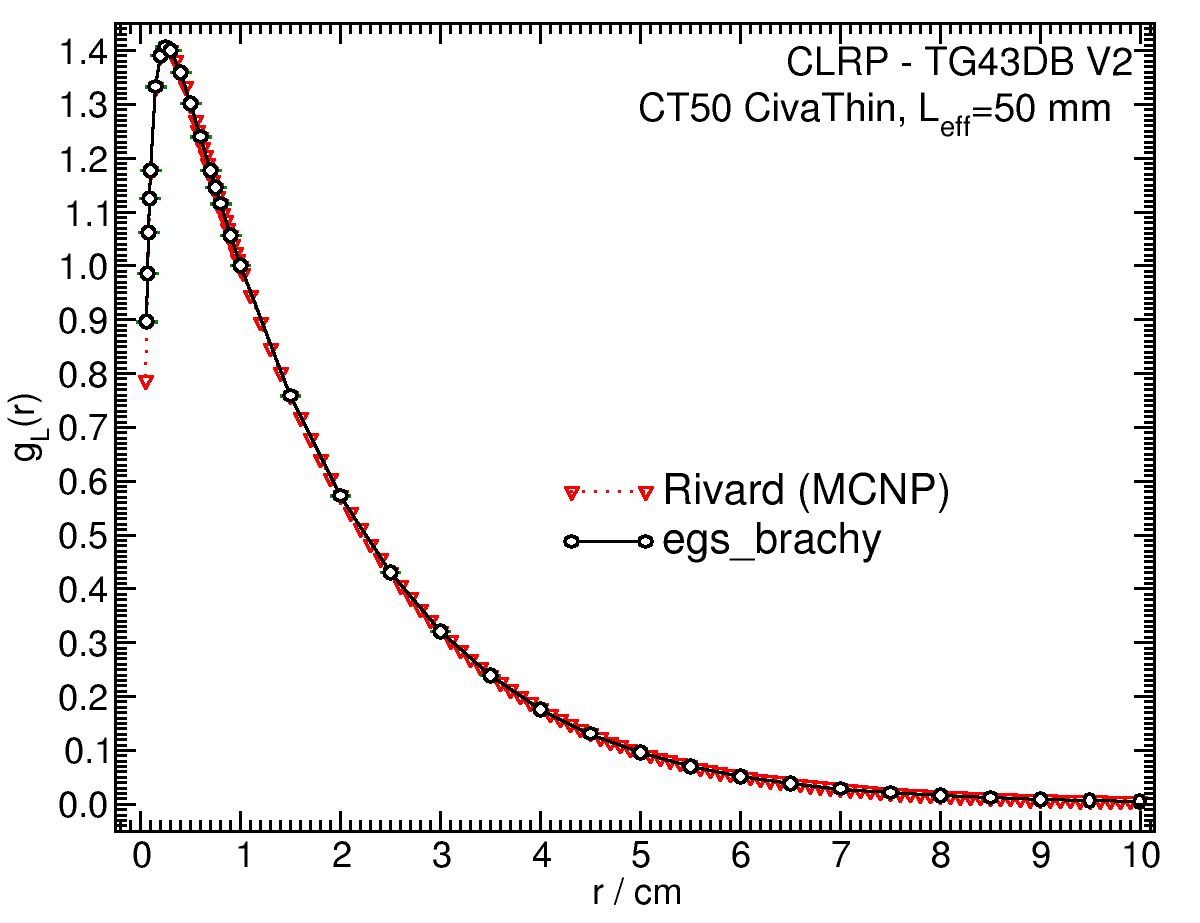
Radial dose function - g(r):
The radial dose function, g(r), is calculated using both line and point source geometry functions and tabulated at 36 different radial distances ranging from 0.19 cm to 10 cm. Fit parameters for a modified polynomial expression are also provided 7. The mean residual deviations from the actual data for the best fit were <0.33%. The supplementary data of Ref. 1 are used in the g(r), and F(r, Θ) comparisons.
| Fitting coefficients for g L (r) = (a0 r-2 + a1 r-1 + a2 + a3r + a4r2 + a5 r3) e-a6r | |||
| Fit range | Coefficients | ||
| r min (cm) | r max (cm) | ||
| 0.09 | 10.00 | a0 / cm2 | (-1.14+/-0.08)E-03 |
| a1 / cm | (-4.5+/-2.5)E-02 | ||
| a2 | (1.8+/-1.0)E+00 | ||
| a3 / cm-1 | (-0+/-4)E+01 | ||
| a4 / cm-2 | (0+/-6)E+00 | ||
| a5 / cm-3 | (0.0+/-2.7)E-01 | ||
| a6 / cm-1 | (0.0+/-2.2)E+01 | ||
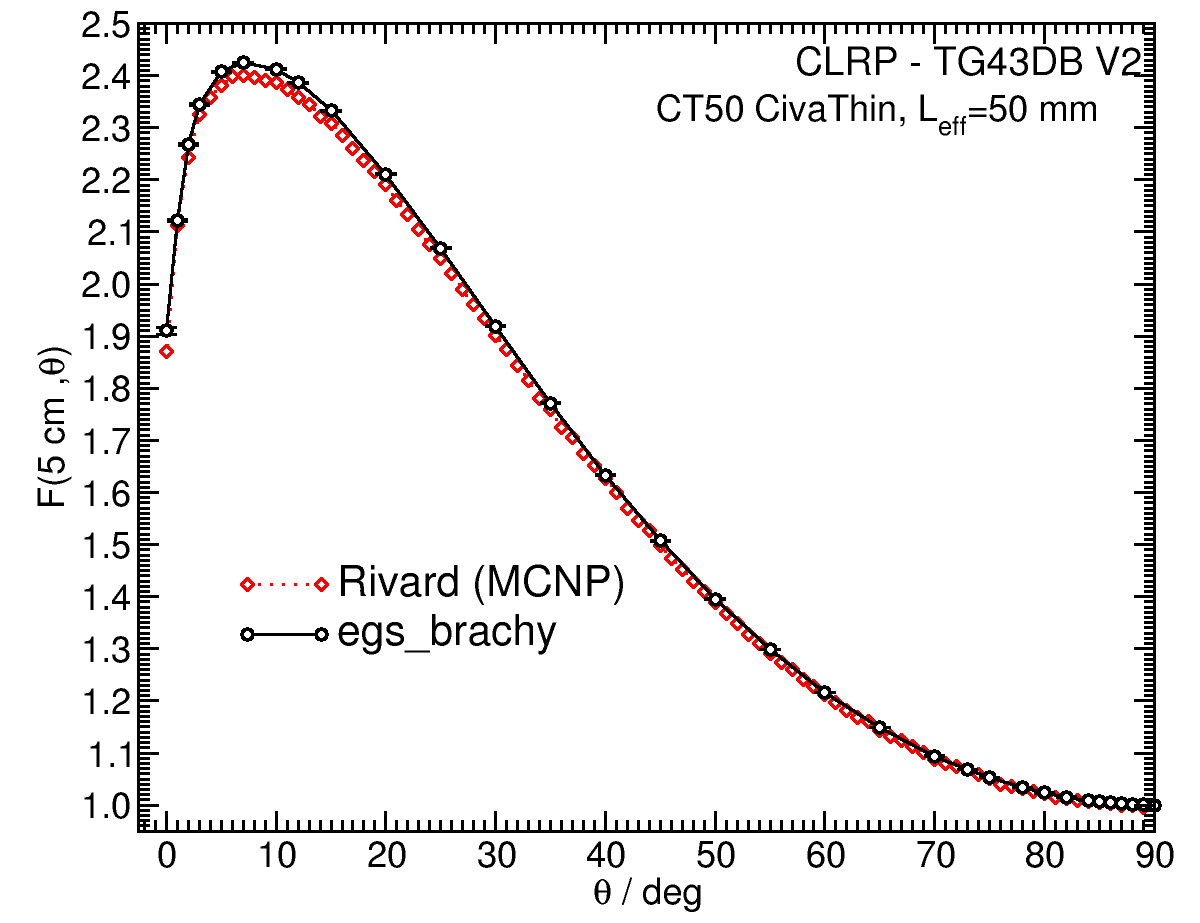
Anisotropy function - F(r,θ):
Anisotropy functions are calculated using the line source approximation and tabulated at radii of 0.1, 0.15, 0.25, 0.5, 0.75, 1, 2, 3, 4, 5, 7.5 and 10 cm and 32 unique polar angles with a minimum resolution of 5° . The anisotropy factor, φan (r), was calculated by integrating the solid angle weighted dose rate over 0° ≤ ϑ ≤ 90° .
F(0.10,θ) 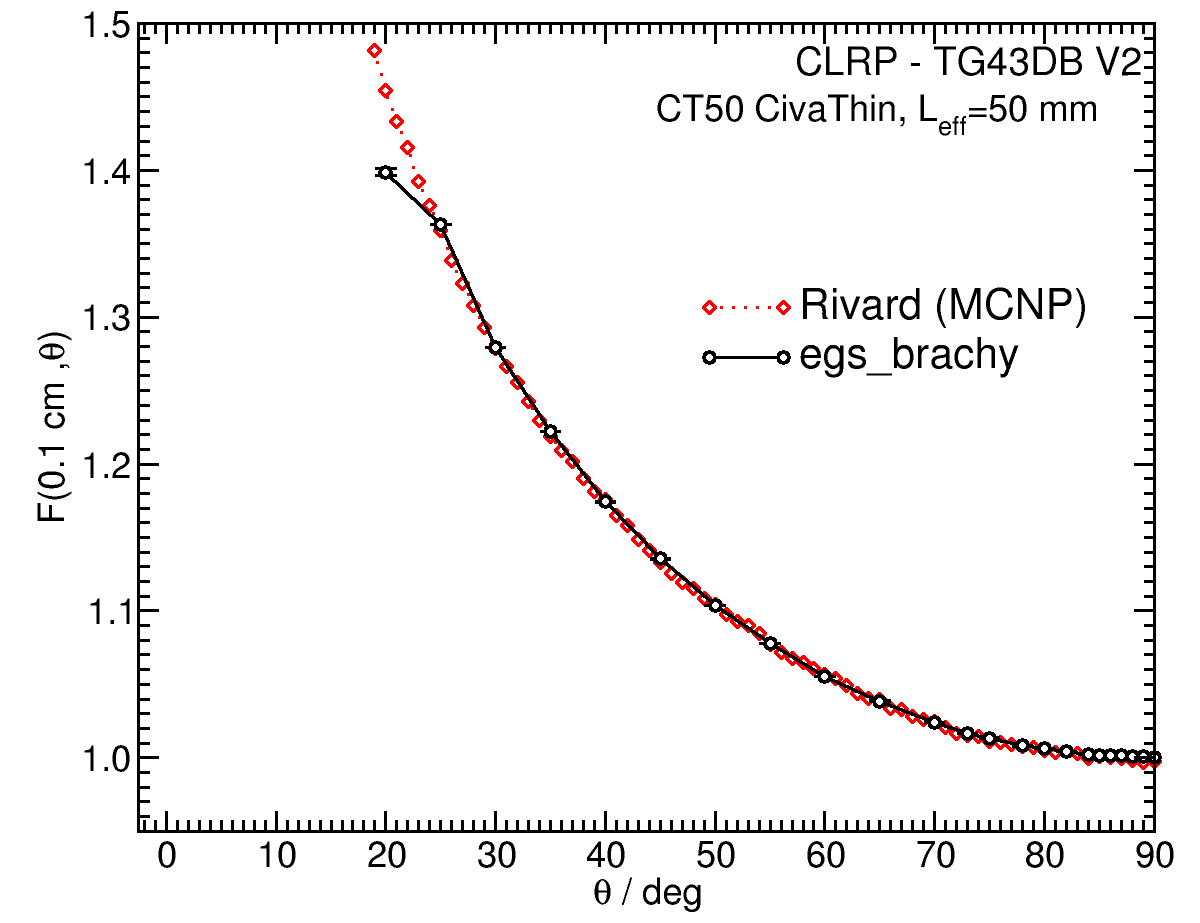 |
F(1.00,θ)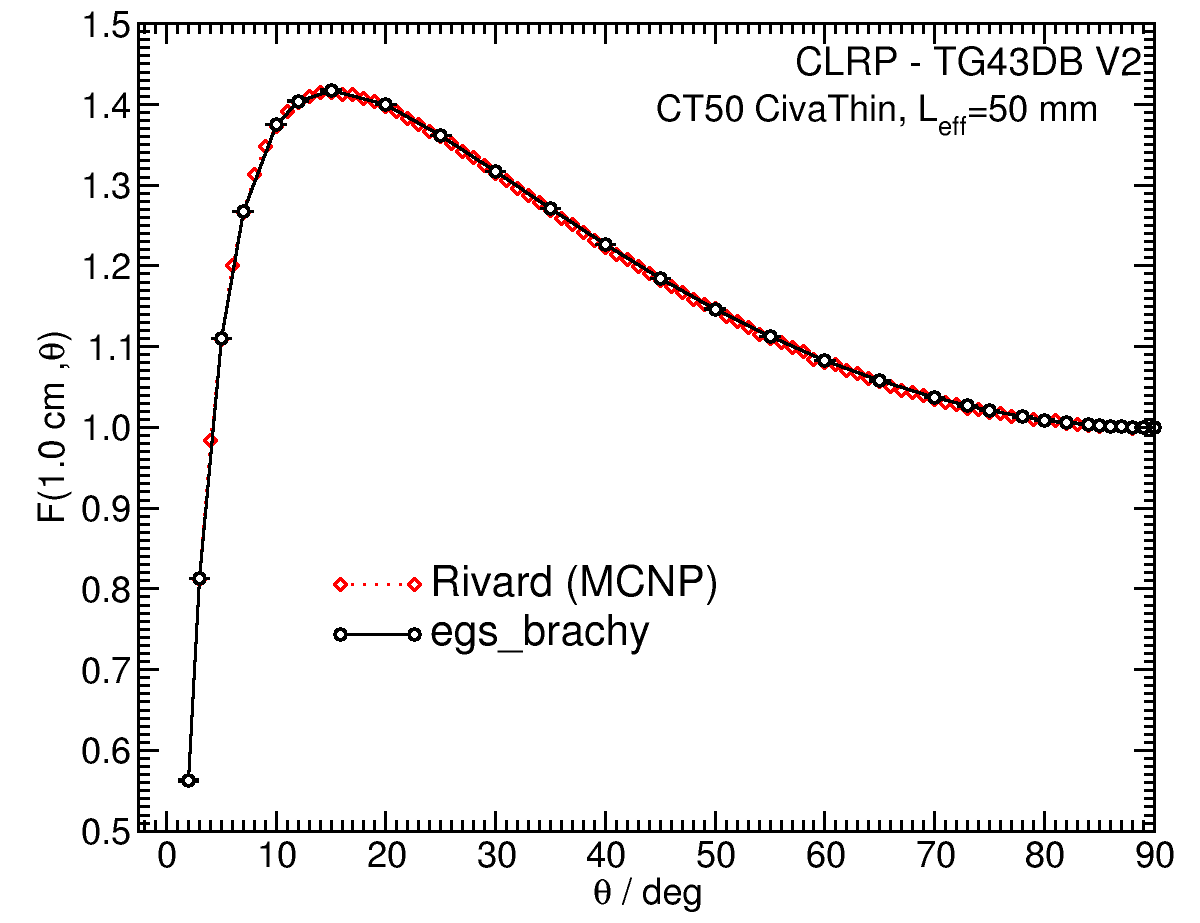 |
|
F(5.00,θ) |
F(7.50,θ) 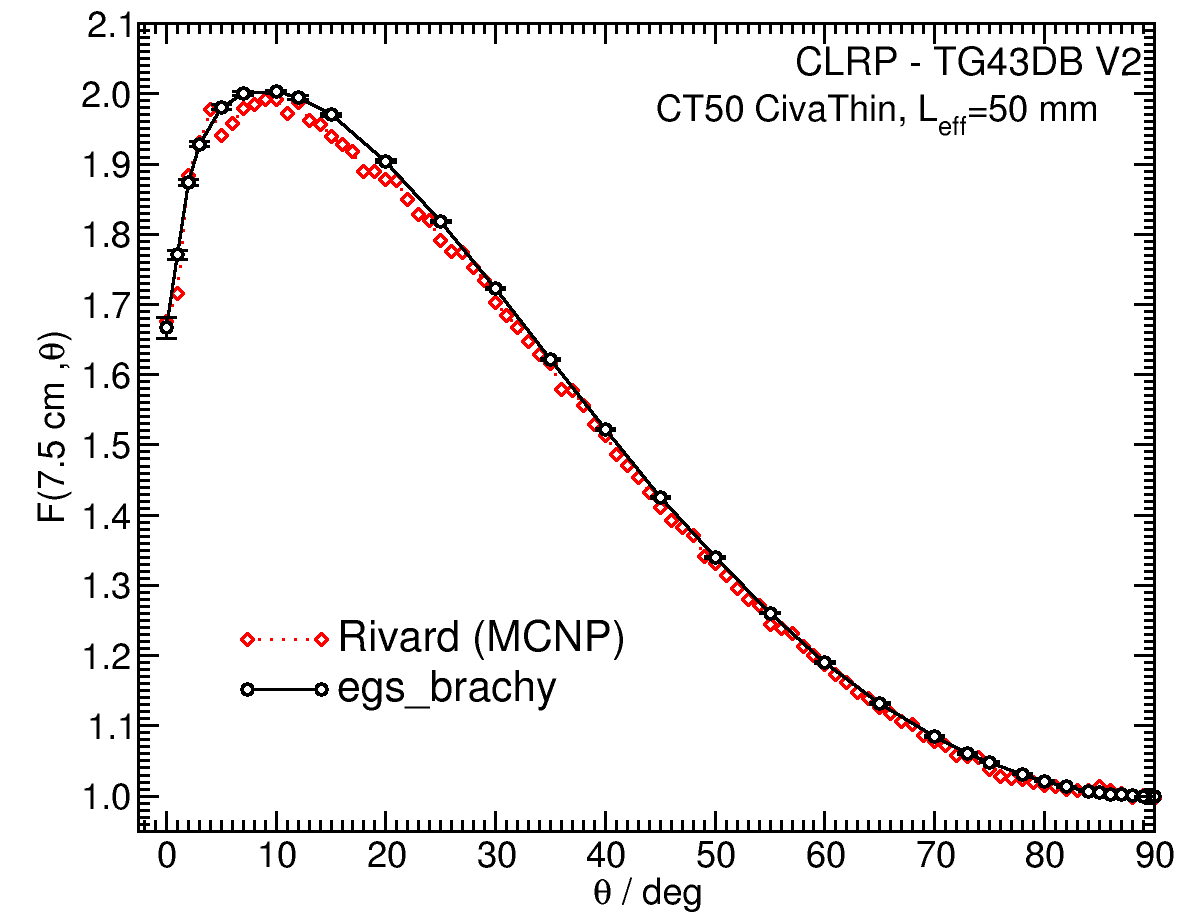 |
Tabulated data:
1. M. J. Rivard et al , 103Pd strings: Monte Carlo assessment of a new approach to brachytherapy source design, Med. Phys., 41 , 011716-11, 2014.
2. J. L. Reed et al , Experimental and Monte Carlo dosimetric characterization of a 1 cm 103Pd brachytherapy source, Brachytherapy, 13 , 657-667, 2014.
3. A.B. Paxton, W.S. Culberson, L.A. DeWerd, and J.A. Micka, Primary calibration of coiled brachytherapy sources, Med. Phys. 35, 32-38,2 008
4. R. Loevinger, Wide-angle free-air chamber for calibration of low-energy brachytherapy sources, Med. Phys., 20 , 907, 1993.
5. S. M Seltzer et al , New National Air-Kerma-Strength Standards for 125I and 103Pd Brachytherapy Seeds, J. Res. Natl. Inst. Stand. Technol.,108,337-358,2003. 6. D. W. O. Rogers, Inverse square corrections for FACs and WAFACs, Appl. Radiat. Isot. 153, 108638 (8pp), 2019. 7. H. Safigholi, M. J. P. Chamberland, R. E. P. Taylor, C. H. Allen, M. P. Martinov, D. W. O. Rogers, and R. M. Thomson, Update of the CLRP TG-43 parameter database for brachytherapy, to be published (Current calculation).
8. M. J. Rivard et al , Supplement 2 for the 2004 update of the AAPM Task Group No. 43 Report: Joint recommendations by the AAPM and GEC-ESTRO, Med. Phys., 44 , e297-e338, 2017.
9. R. E. P. Taylor, D. W. O. Rogers, More accurate fitting of 125I and 103Pd radial dose functions, Med. Phys., 35 , 4242-4250, 2008.
Carleton Laboratory for Radiotherapy Physics
CLRP TG-43 Parameter Database V2
May 5, 2020