
Source Description:
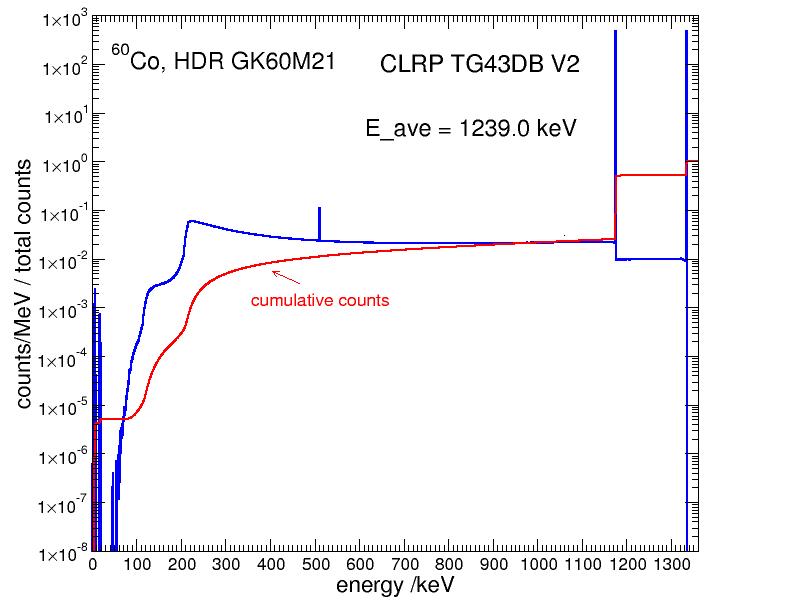
Dimensions for the BEBIG Multisource HDR GK60M21 source are taken from the study by Ballester et al 1. The source consists of a 3.50 mm long 60Co core with a diameter of 0.6 mm enclosed in a 1.0 mm diameter AISI 316L stainless steel capsule (density of 7.8 g/cm3). The encapsulation is a 0.84 mm long cylindrical section followed by a 3.5-mm long hollow section with an inner diameter assumed to be 0.7 mm. The last section of the capsule is a 0.6 mm long solid cylinder overlapped by an air cone with a thickness of 0.2 mm. A total of 5 mm of cable was included in this simulation and the cable was assumed to be composed of AISI 316L steel with a density of 6.9 g/cm3. The active length of this source is 3.5 mm. The mean photon energy calculated on the surface of the source is 1239.0 keV with statistical uncertainties < 0.001% .
Note: All the results presented in theTable, Figures, xlsx, and zip files are with electron transport in phantom except where noted.
Dose Rate Constant - Λ :
Dose-rate constants, Λ , are calculated by dividing the dose to water per history in a (0.1 mm)3 voxel centred on the reference position, (1 cm, Π/2), in the 80x80x80 cm3 water phantom, by the air-kerma strength per history factor (scored in vacuo). Air kerma per history is always calculated using a tracklength estimator in a 10x10x0.05 cm3 air voxel located in vacuo on the transverse axis 100 cm away from the source and then corrected (kr2 = 1.00217) for the lateral and thickness dimensions of the scoring voxel to give the air kerma per history on the central axis at a point 100 cm from the source’s mid-point as described in our previous study 2, 3 . Low-energy photons emitted from the source encapsulation are suppressed in the air-kerma calculations by discarding all photons with energy less than 10 keV (i.e., PCUT set to 10 keV in EGSnrc). MC uncertainties are only statistical uncertainties (k=1).
| Author | Method | Λ (cGy h-1 U-1) | Abs. Uncertainty |
| Safigholi et al (with e- transport) 4 | 10x10x0.5 cm3 voxel at 100 cm | 1.0966 | 0.0008 |
| Safigholi et al (no e- transport) 4 | 10x10x0.5 cm3 voxel at 100 cm | 1.0855 | 0.0002 |
| Selvam and Bhola (with e- transport) 5 | EGSnrc | 1.093 | 0.002 |
| Ballester et al (no e- transport) 1 | GEANT4 (extra) | 1.084 | 0.005 |
| Perez-Calatayud et al 6 | Consensus value | 1.089 | 0.005 |
Radial dose function - g(r):
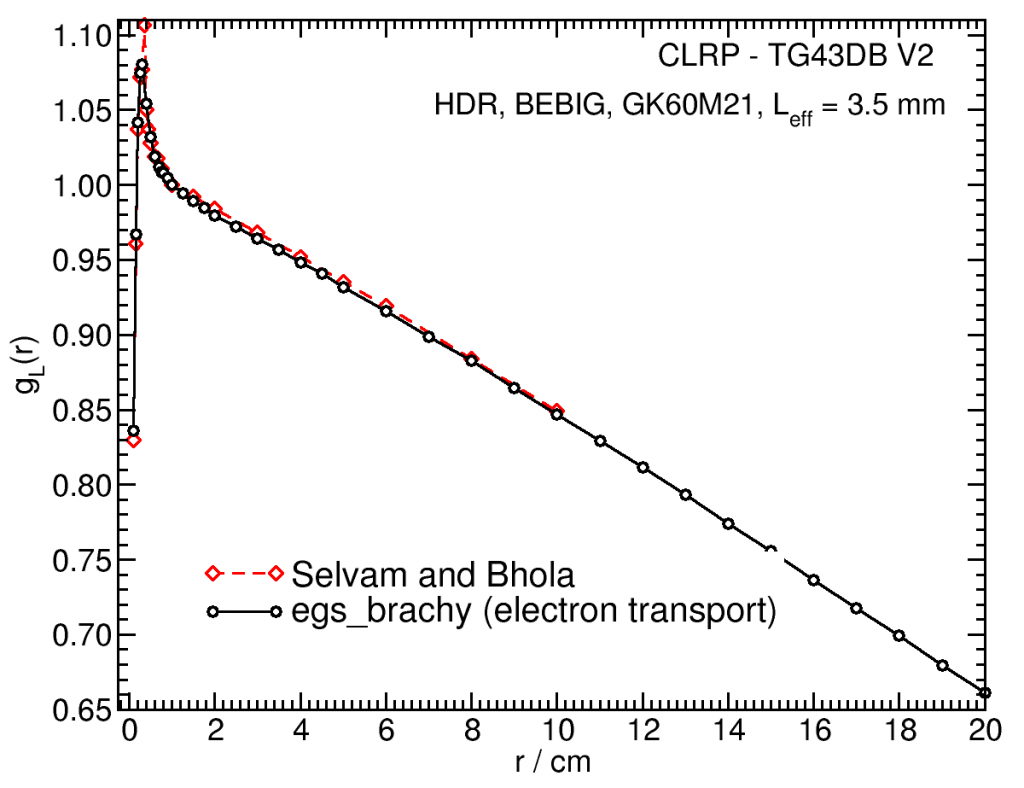
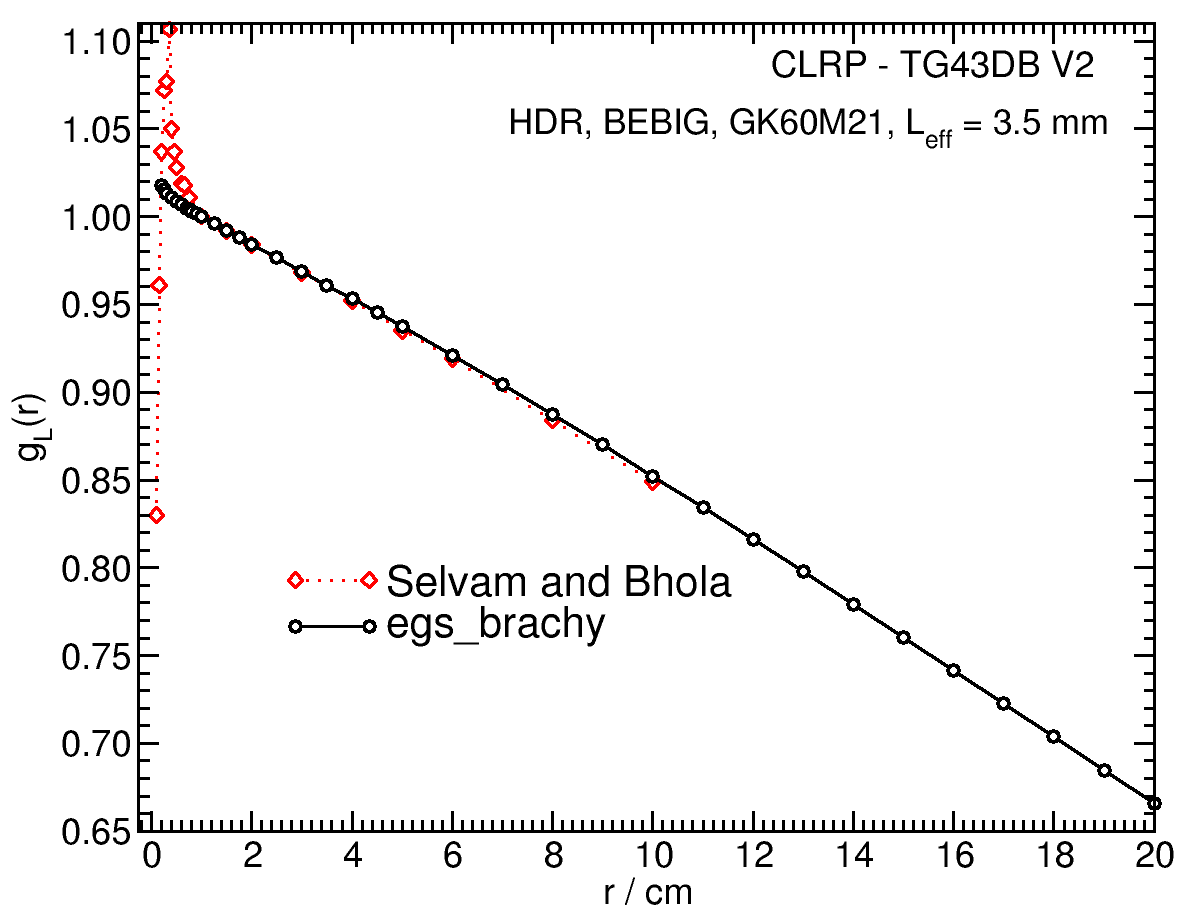
The radial dose function, g(r), is calculated using both line and point source geometry functions and tabulated at 36 different radial distances ranging from 0.2 cm to 20 cm.
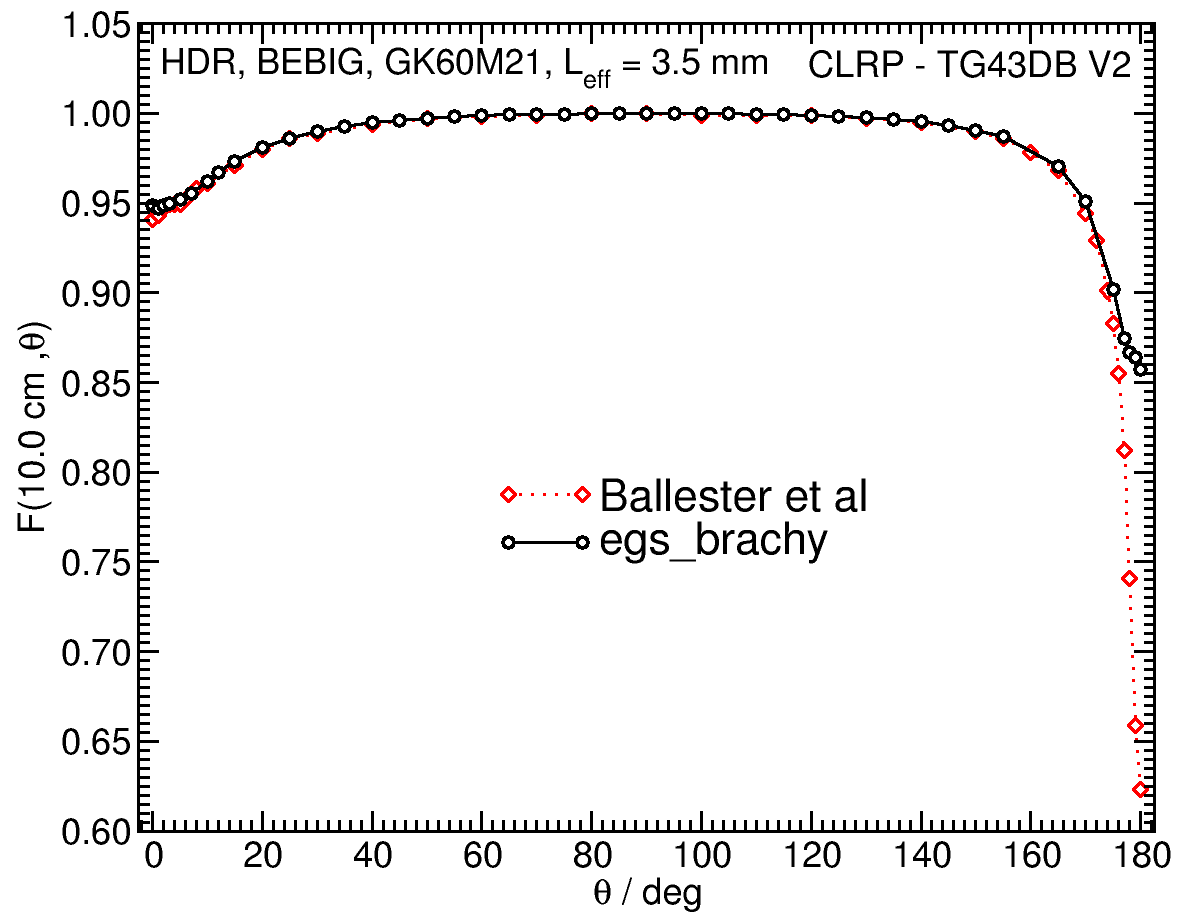
Anisotropy function - F(r,θ):
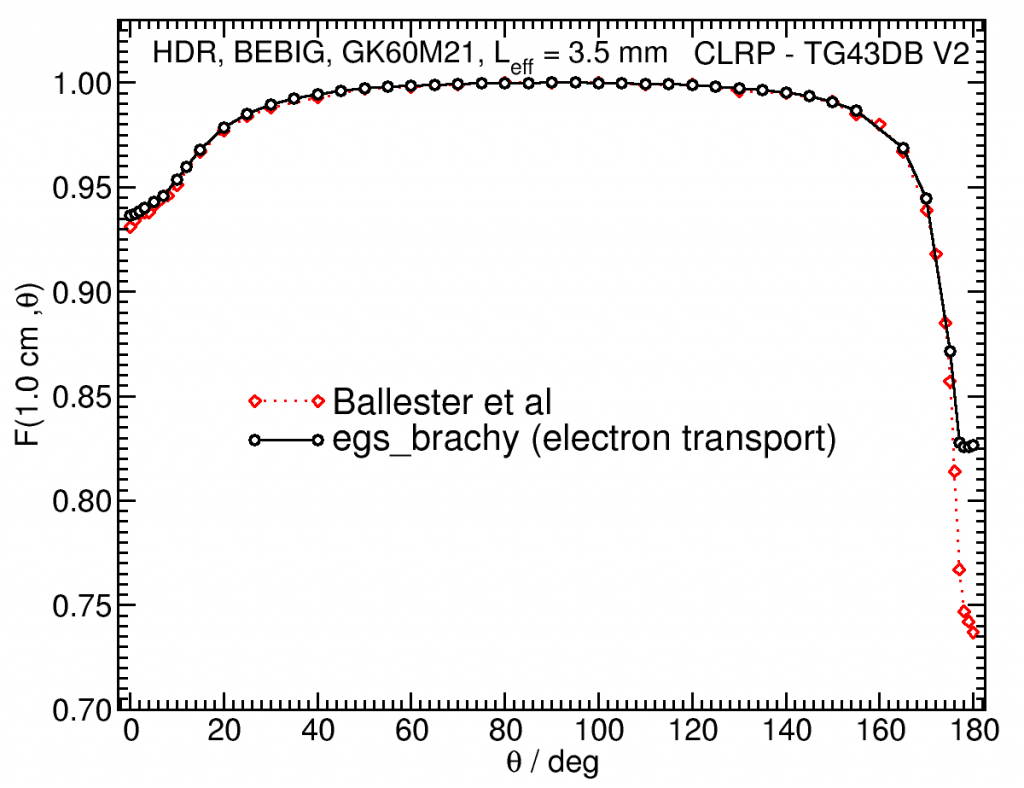
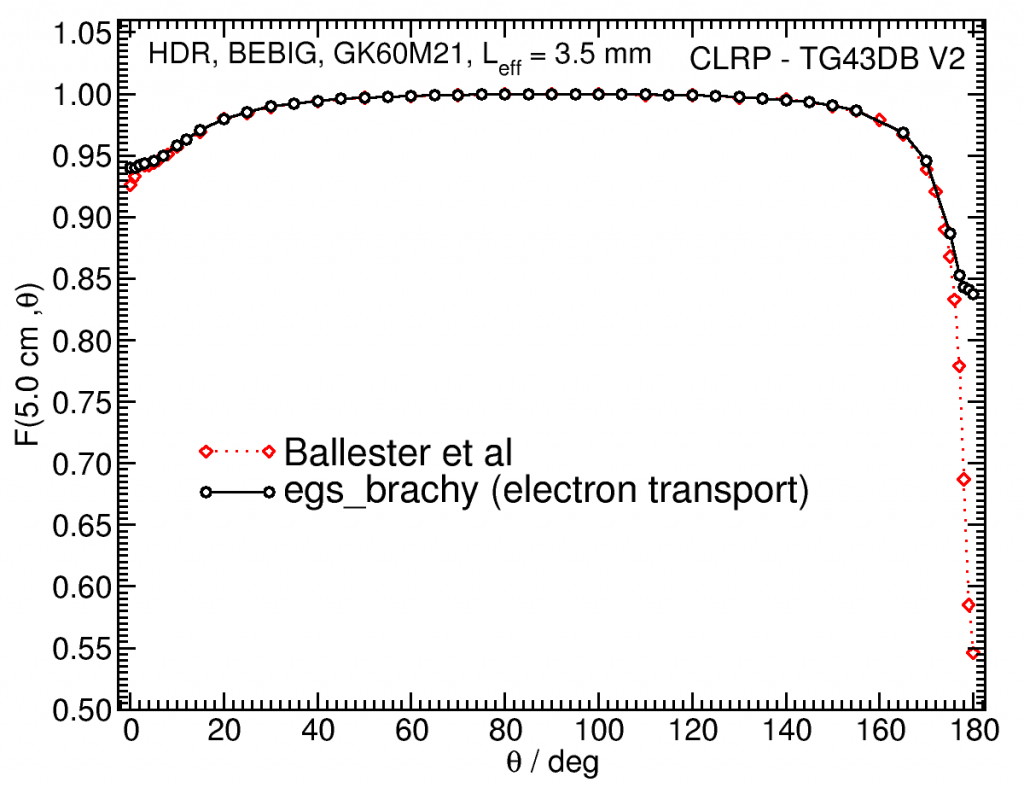
Anisotropy functions are calculated using the line source approximation and tabulated at 12 radii from 0.25 cm to 20 cm and 47 unique polar angles with a resolution of 5°or better. The anisotropy factor, φan(r), was calculated by integrating the solid angle weighted dose rate over 0° ≤ ϑ ≤ 180°.
Click images for higher res versions

Along-Away Dose Data:
Along-away dose data are tabulated at 16 away distances from 0 cm to 20 cm and 31 along points from -20 cm to 20 cm. Doses are normalized to SK , the air-kerma strength.
Primary and Scatter Separated (PSS) Dose Data: Dii (r,θ):
Primary and Scatter Separated (PSS) dose data are tabulated at 12 radii from 0.25 cm to 20 cm and 47 unique polar angles with a resolution of 5° or better. High resolution (Δr = 1 mm, ΔΘ = 1°) primary scatter dose data are also available in .csv files. For the purposes of these calculations any photon escaping the source encapsulation is considered a primary. Only photons which scatter within the phantom are counted in the scatter tallies. Doses are normalized to the total photon energy escaping the encapsulation. The "ii" subscript labelled in the Dii(r, θ) represent the total scatter as Dto(r, θ), the primary photons as Dpr(r, θ), the single scatter photons as Dss(r, θ), and the multiple scatter photons as Dms (r, θ) .
Click images for higher res versionsD ii (r,90°)*r 2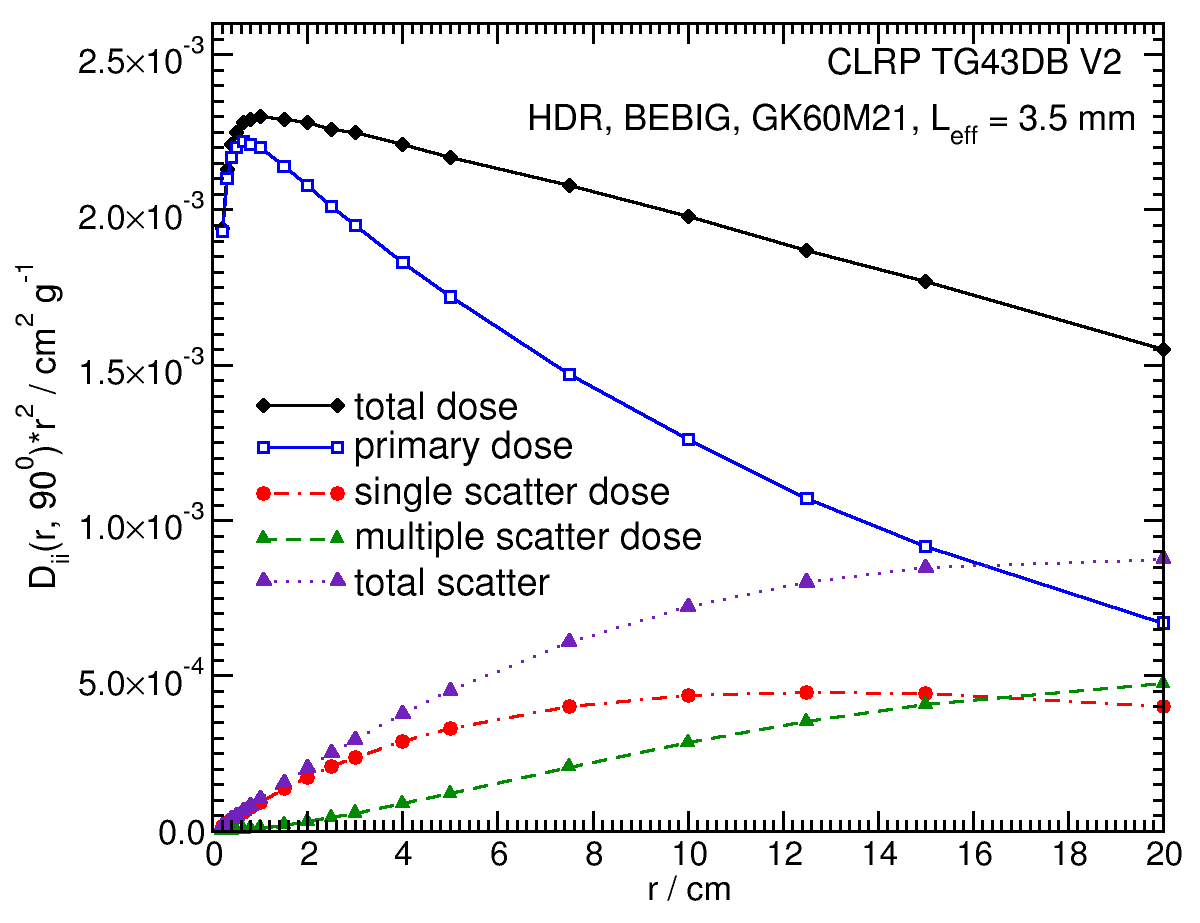 |
D ii (1.00,θ)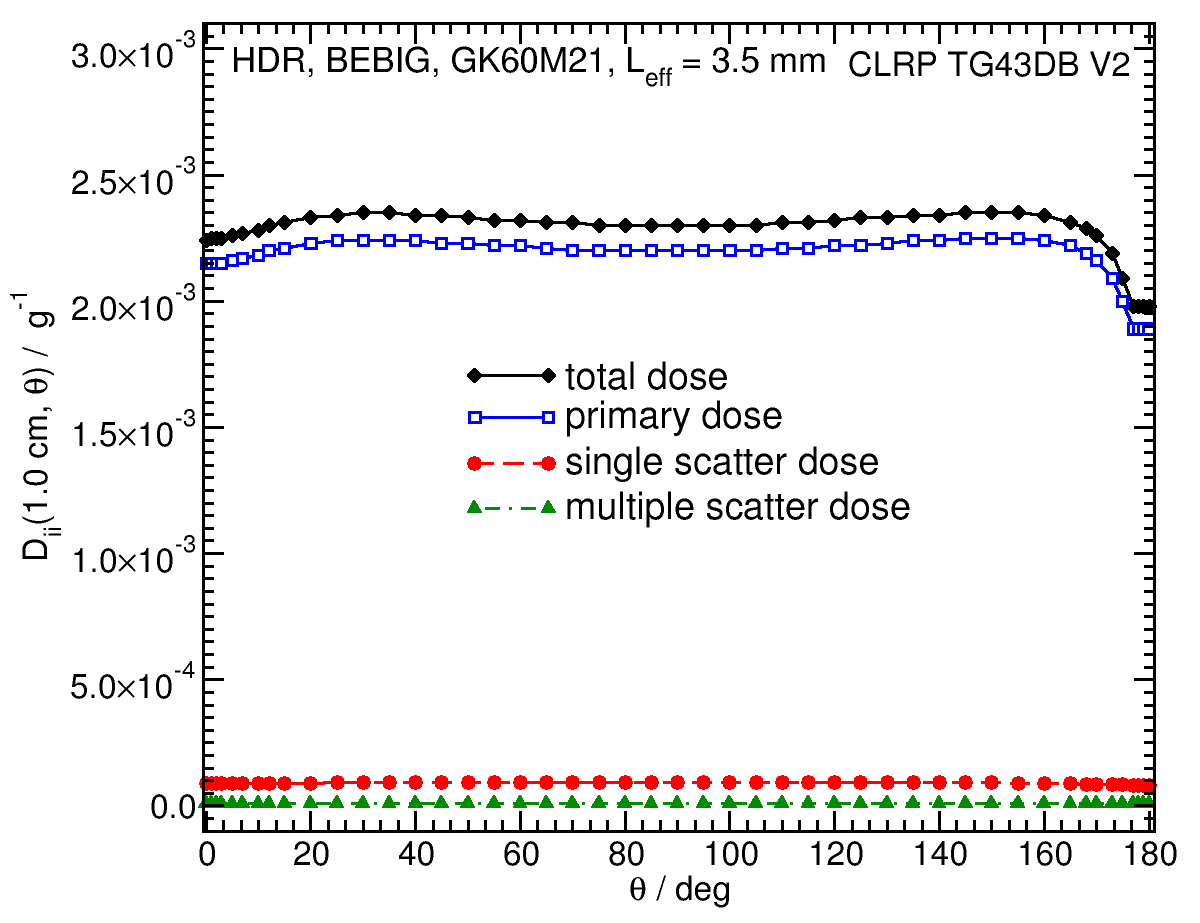 |
D ii (5.00,θ)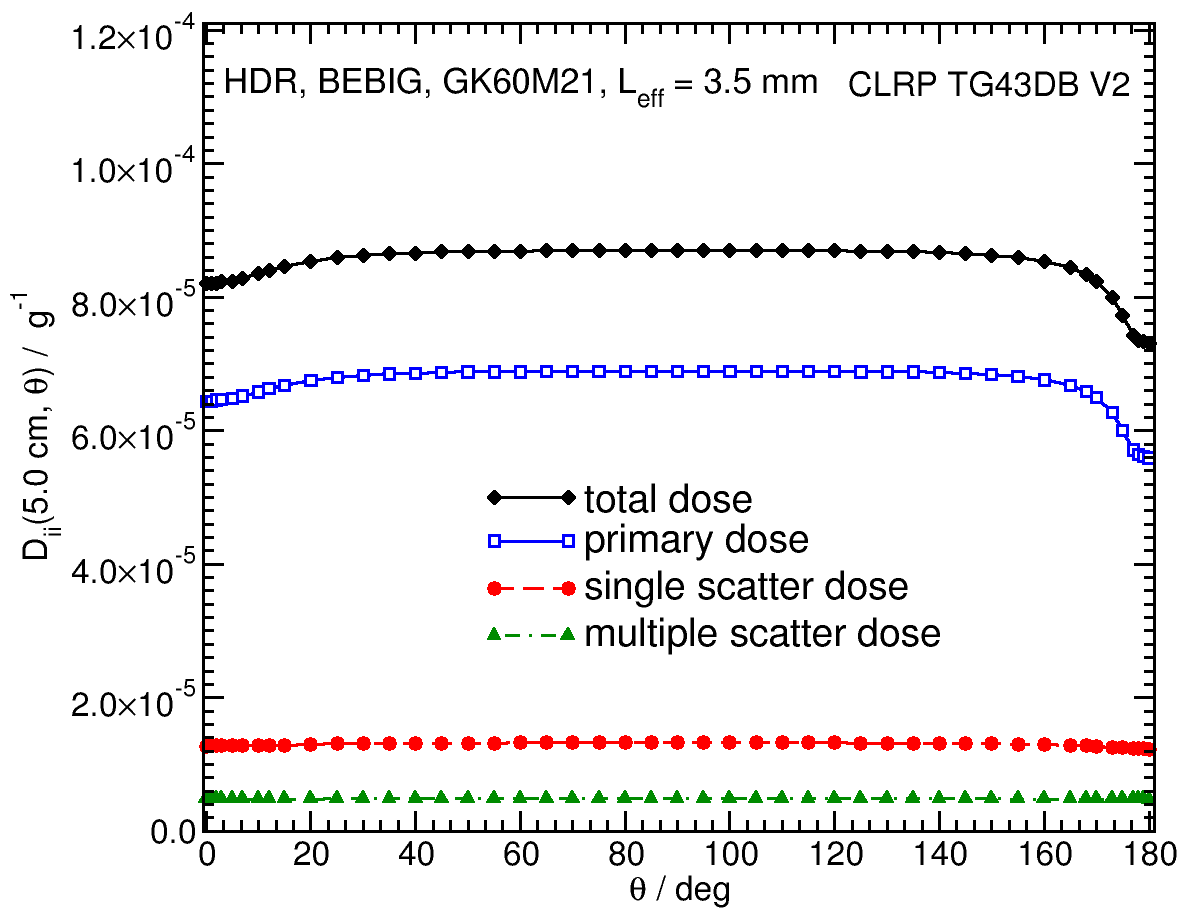 |
D ii (10.00,θ)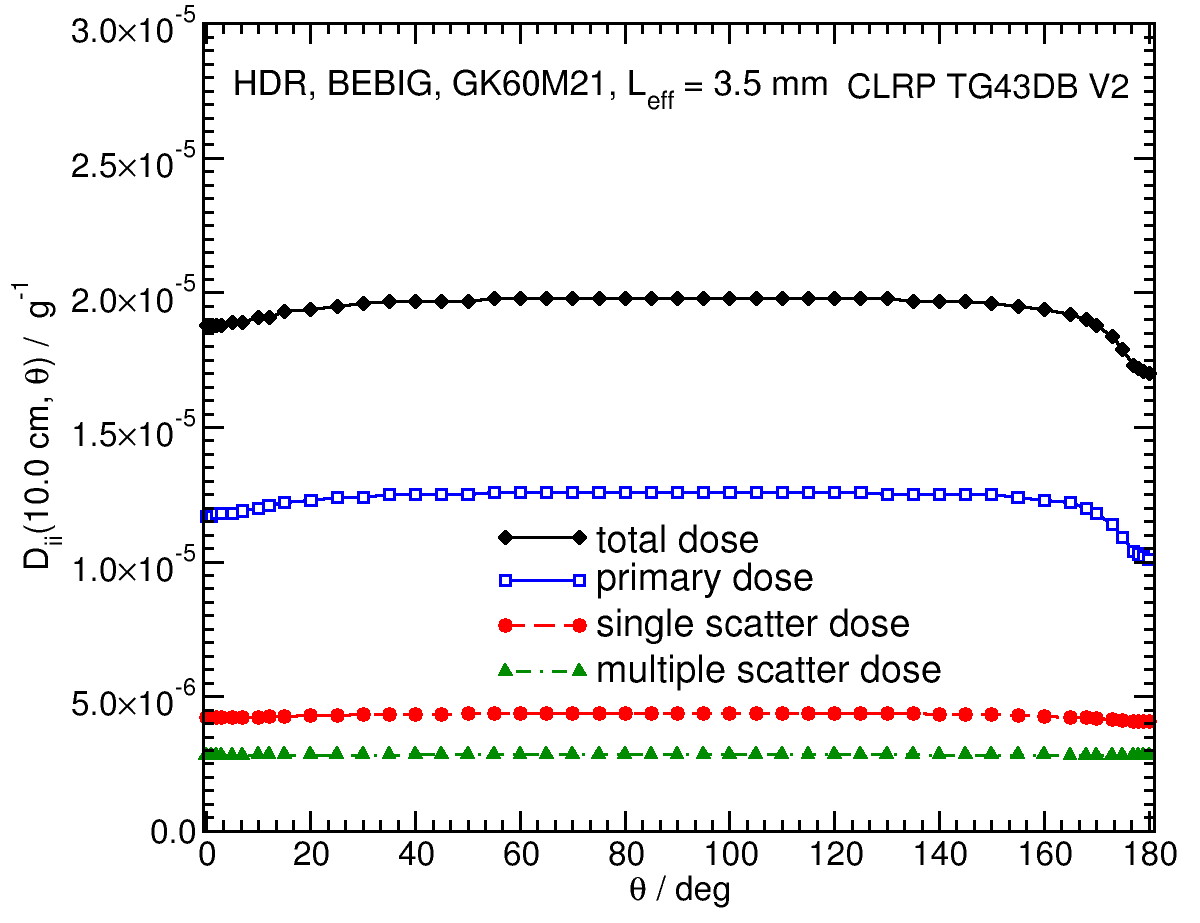 |
High resolution (1mm/1°) Tabulated D ii (r,θ) data in .csv format: Zipped archive
Photon Energy Spectra
Photon energy spectra generated by the source model are calculated using the egs_brachy surface count scoring option to get the spectrum on the surface of the source. The plotted values are the counts per MeV in 1 keV bins, normalized to 1 count total in the spectrum. The MC calculations have a statistical uncertainty less than 0.001% on the mean energy. The spectrum data are available in xmgrace format below.
Photon energy spectra on source surface: xmgrace
Tabulated data:
Tabulated data are available in .xlsx format: Excel
References:
1.Ballester et al, Monte Carlo dosimetric study of the BEBIG Co-60 HDR source, Phys. Med. Biol., 50 , 309 - 316, 2005
2.R. E. P. Taylor et al , Benchmarking BrachyDose: voxel-based EGSnrc Monte Carlo calculations of TG--43 dosimetry parameters, Med. Phys., 34 , 445 - 457, 2007
3. D. W. O. Rogers, Inverse square corrections for FACs and WAFACs, Appl. Radiat. Isot.,153 ,108638, 2019
4.H. Safigholi, M. J. P. Chamberland, R. E. P. Taylor, C. H. Allen, M. P. Martinov, D. W. O. Rogers, and R. M. Thomson, Update of the CLRP TG-43 parameter database for high-energy brachytherapy sources, to be published (Current calculation)
5. T. P. Selvam and S. Bhola, Technical note: EGSnrc-based dosimetric study of the BEBIG 60Co HDR brachytherapy sources, Med. Phys., 34, 1365–1370, 2010
6. Pérez-Calatayud et al , Dose Calculation for Photon-Emitting Brachytherapy Sources with Average Energy Higher than 50 keV: Full Report of the AAPM and ESTRO, 2012 by AAPM, ISBN: 978-1-936366-17-0