Source Description:
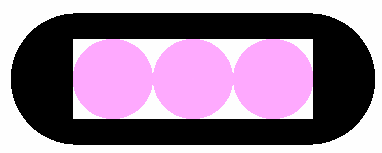
Dimensions for the Amersham CDC-3 source are taken from the study by Perez-Calatayud et al 1 and Casal et al 2. The CDC-3 source is a symmetrical source and consists of three active spherical beads of a Borosilicate glass [elemental composition by mass: Si (26.18%), Ti (3.0%), Al (1.59%), B (3.735), Mg (1.21%), Ca (2.86%), Na (12.61%), Cs (0.94%), O (47.89%); with a density of 2.9 g/cm3] with a diameter of 1.10 mm located at the source center (0) and of center (± 1.1 mm). The radioactive material is uniformly distributed into the Borosilicate beads. The active beads are encapsulated in an AISI 316L stainless steel capsule (density of 7.8 g/cm3) with a 1.25 mm thick wall and an outer diameter of 1.80 mm. The source end welds are 0.85 mm thick and are modelled as 0.90 mm hemisphere with its centre shifted by 0.05 mm relative to the source centre. Air fills the unoccupied volumes in the source. The active length of this source is 3.30 mm. The mean photon energy calculated on the surface of the source is 647.46 keV with statistical uncertainties < 0.001% .
Dose Rate Constant - Λ :
Dose-rate constants, Λ , are calculated by dividing the dose to water per history in a (0.1 mm)3 voxel centered on the reference position, (1 cm, Π/2), in a 80x80x80 cm3 water phantom, by the air-kerma strength per history factor (scored in vacuo). Air kerma per history is always calculated using a tracklength estimator in a 10x10x0.05 cm3 air voxel located in vacuo on the transverse axis 100 cm away from the source and then corrected kr2 = 1.00217) for the lateral and thickness dimensions of the scoring voxel to give the air kerma per history on the central axis at a point 100 cm from the source’s mid-point as described in our previous study 3,4. Low-energy photons emitted from the source encapsulation are suppressed in the air-kerma calculations by discarding all photons with energy less than 10 keV (i.e., PCUT set to 10 keV in EGSnrc). Electron transport is not included in MC simulations for this source. egs_brachy uncertainties are only statistical uncertainties (k=1).
Radial dose function - g(r):
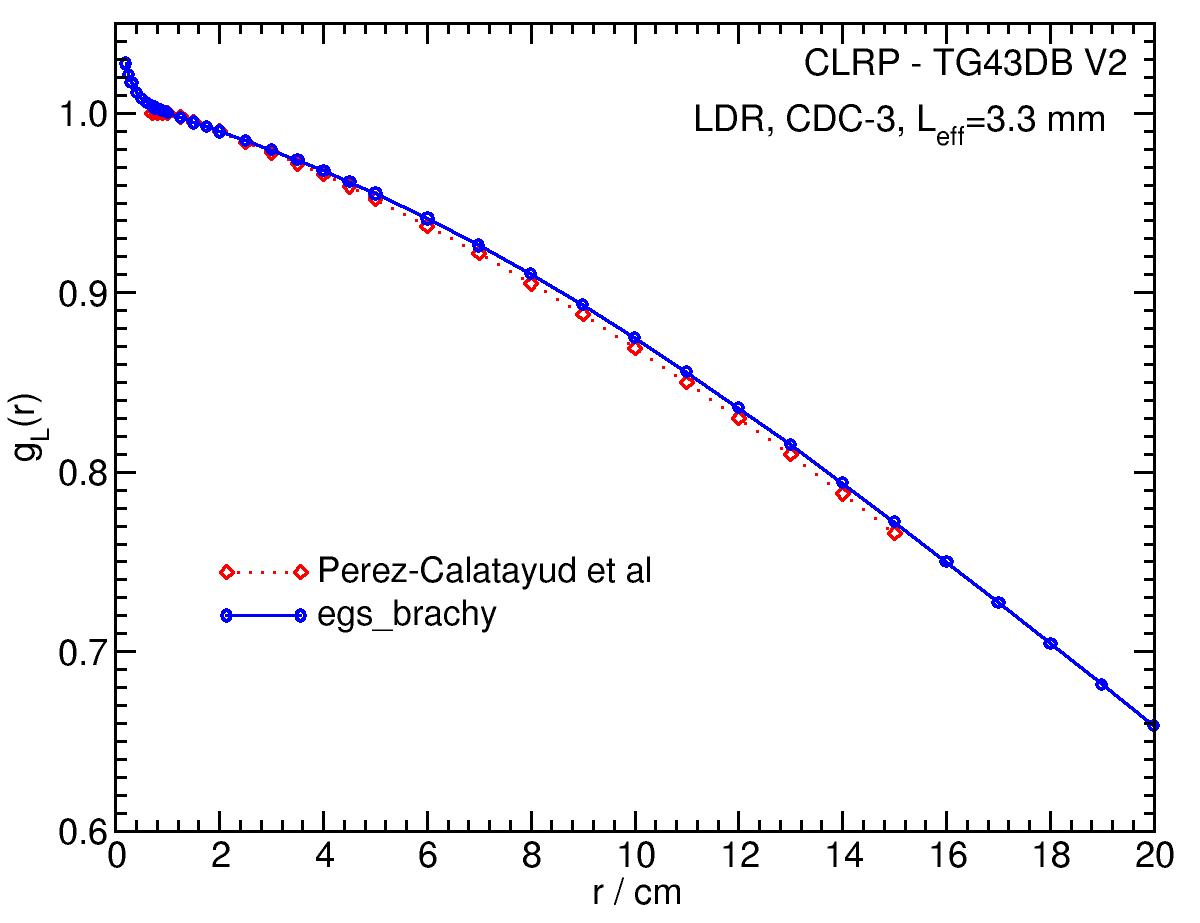
The radial dose function, g(r), is calculated using both line and point source geometry functions and tabulated at 36 different radial distances ranging from 0.2 cm to 20 cm.
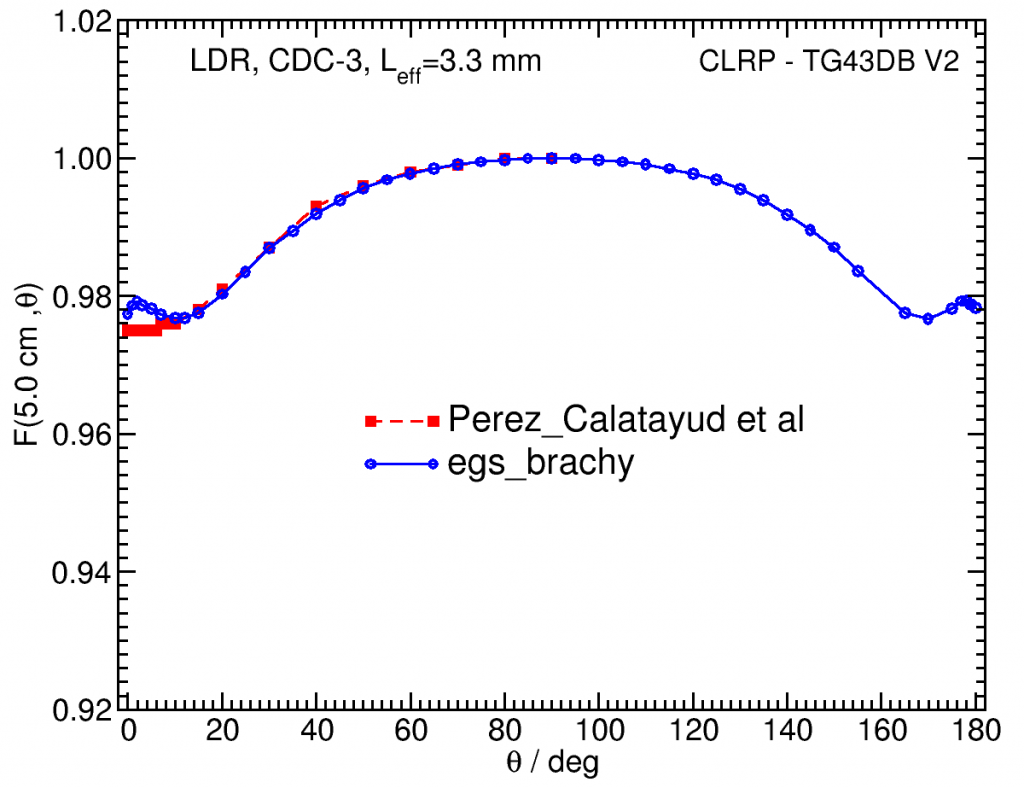
Anisotropy function - F(r,θ):
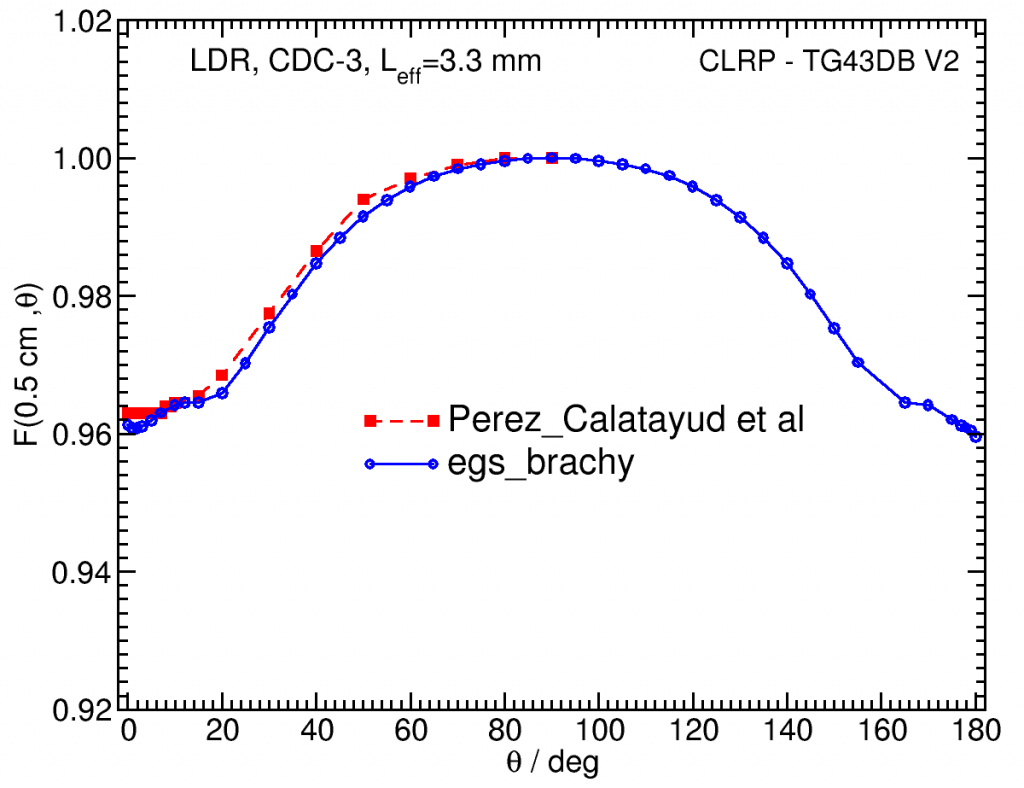
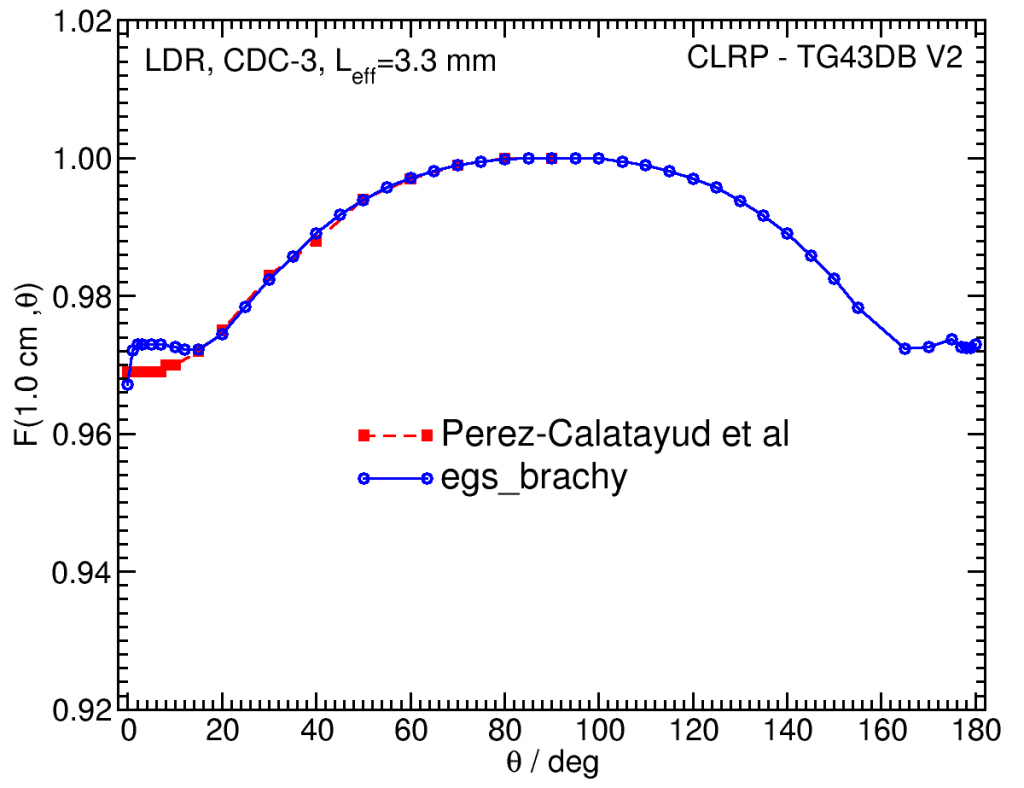
Anisotropy functions are calculated using the line source approximation and tabulated at 13 radii from 0.25 cm to 20 cm and 47 unique polar angles with a resolution of 5° or better. The anisotropy factor, φan (r), was calculated by integrating the solid angle weighted dose rate over 0° = ϑ = 180° .
| F(0.50,θ)
|
F(1.00,θ)
|
| F(5.00,θ)
|
Along-Away Dose Data:
Along-away dose data are tabulated at 16 away distances from 0 cm to 20 cm and 28 along points from -20 cm to 20 cm. Doses are normalized to SK, the air kerma strength.
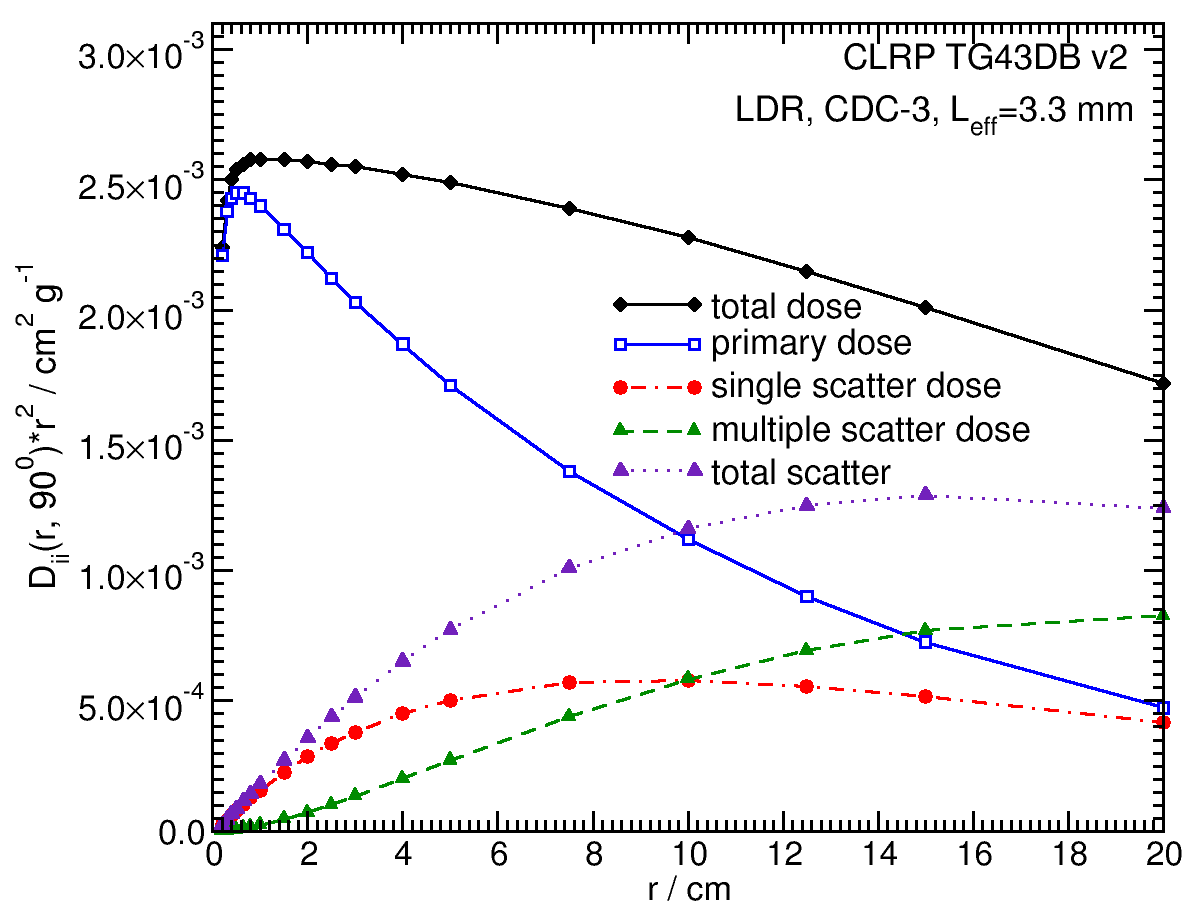
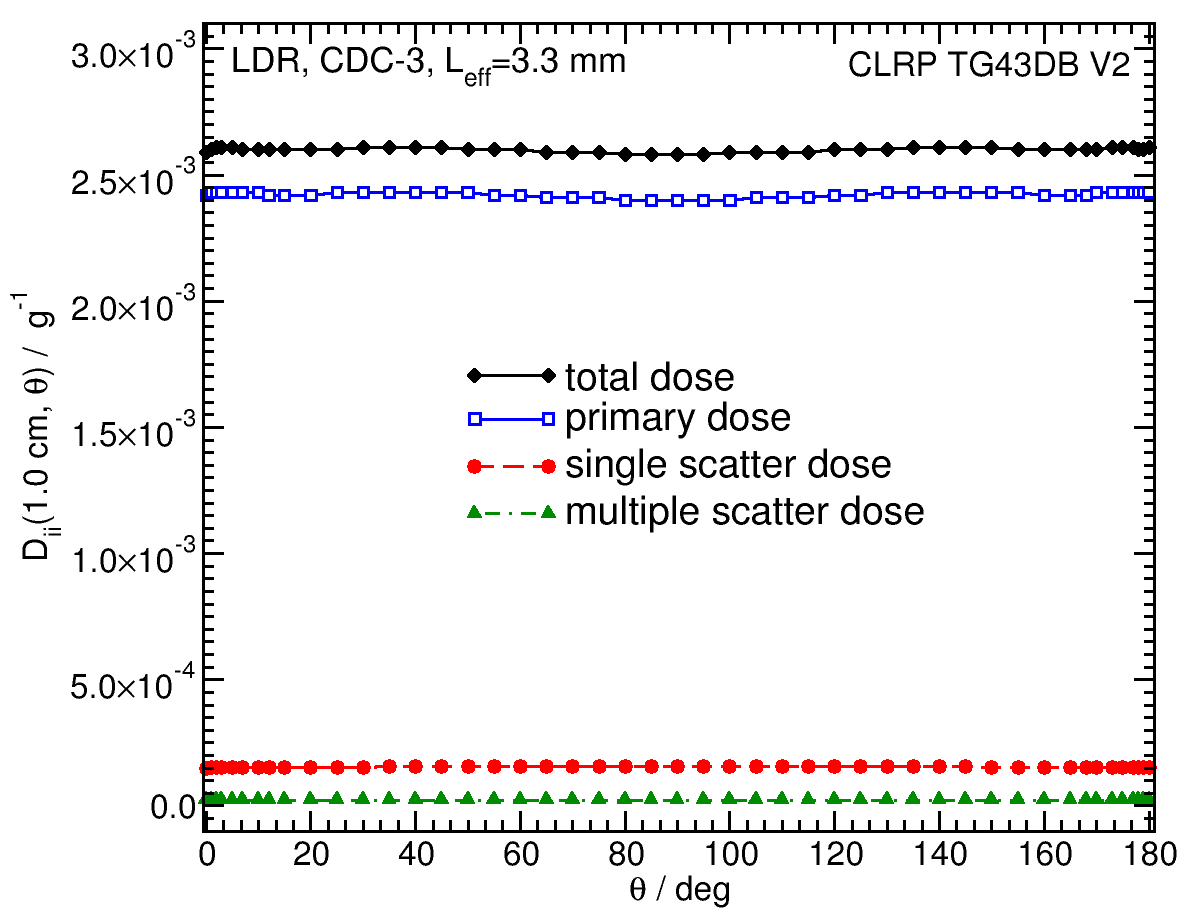
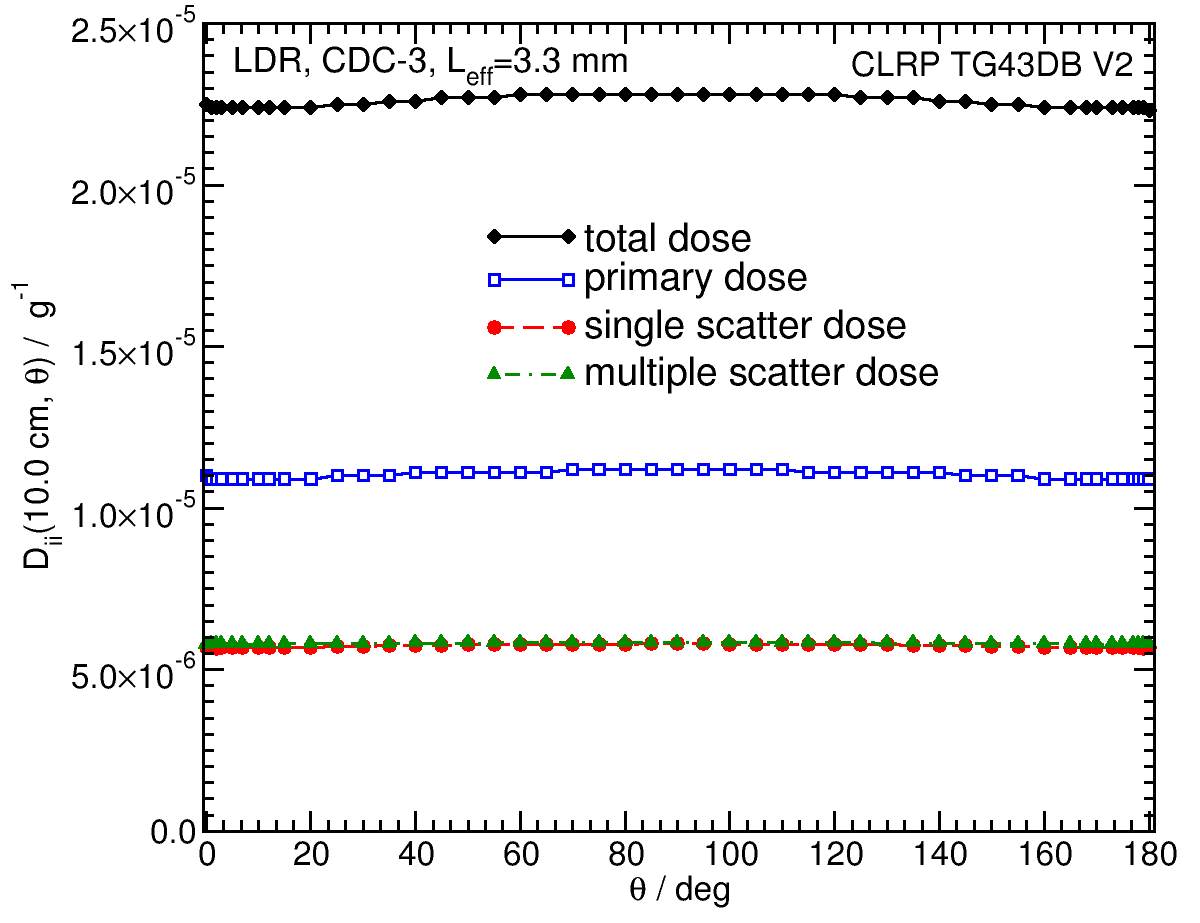
Primary and Scatter Separated (PSS) Dose Data: D ii (r,θ):
Primary and Scatter Separated (PSS) dose data are tabulated at 12 radii from 0.3 cm to 20 cm and 47 unique polar angles with a resolution of 5°or better. High resolution (Δr = 1 mm, ΔΘ = 1°) primary scatter dose data are also available in .csv files. For the purposes of these calculations, any photon escaping the source encapsulation is considered a primary. Only photons that scatter within the phantom are counted in the scatter tallies. Doses are normalized to the total photon energy escaping the encapsulation. The "ii" subscript labeled in the Dii(r, θ) represent the total scatter as Dto(r, θ), the primary photons as Dpr(r, θ), the single scatter photon as Dss(r, θ), and the multiple scatter photons as Dms (r, θ).
|
Dii (r,90°)*r 2
|
Dii (1.00,θ)
|
Dii (5.00,θ) 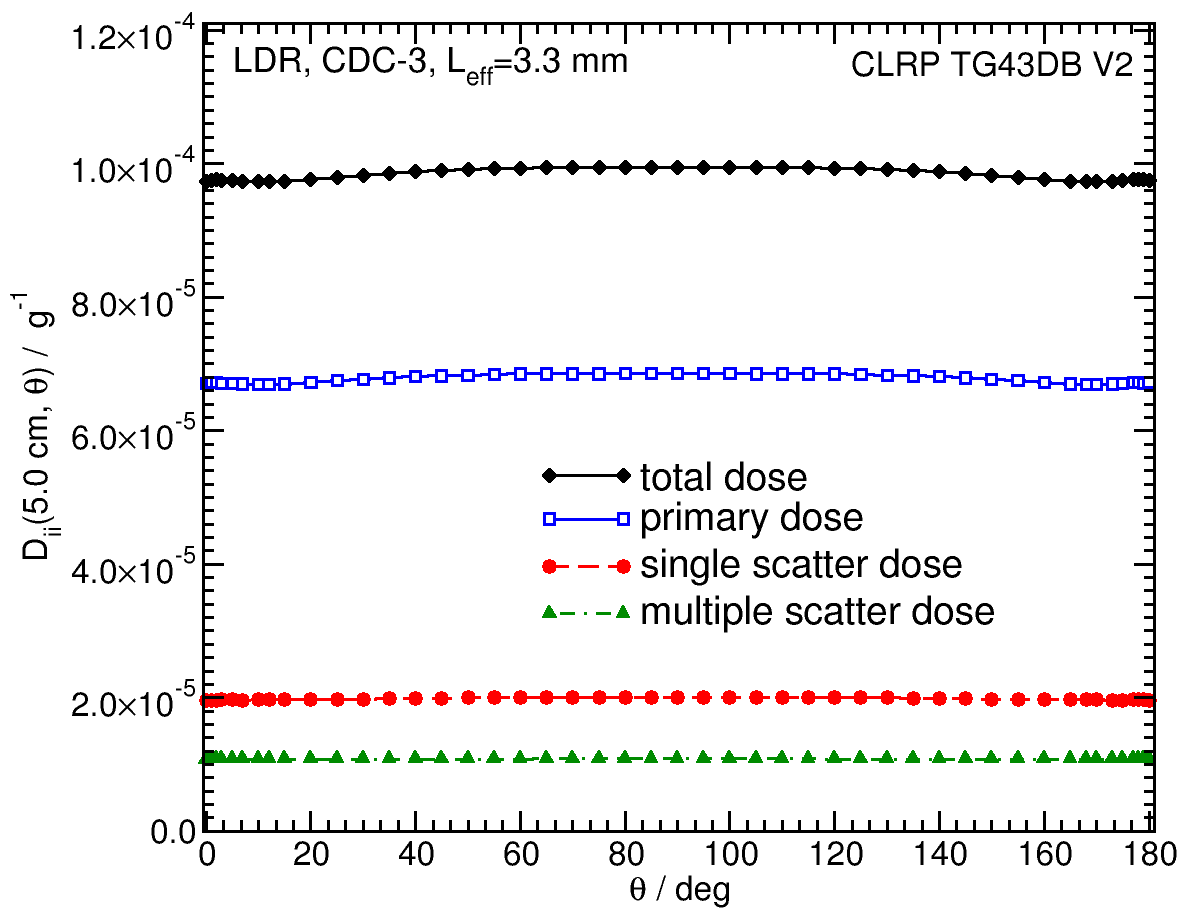 |
Dii (10.00,θ) |
Photon Energy Spectra
Photon energy spectra generated by the source model are calculated using the egs_brachy surface count scoring option to get the spectrum on the surface of the source. The plotted values are the counts per MeV in 1 keV bins, normalized to 1 count total in the spectrum. The MC calculations have a statistical uncertainty less than 0.001% on the mean energy. The spectrum data are available in xmgrace format below.
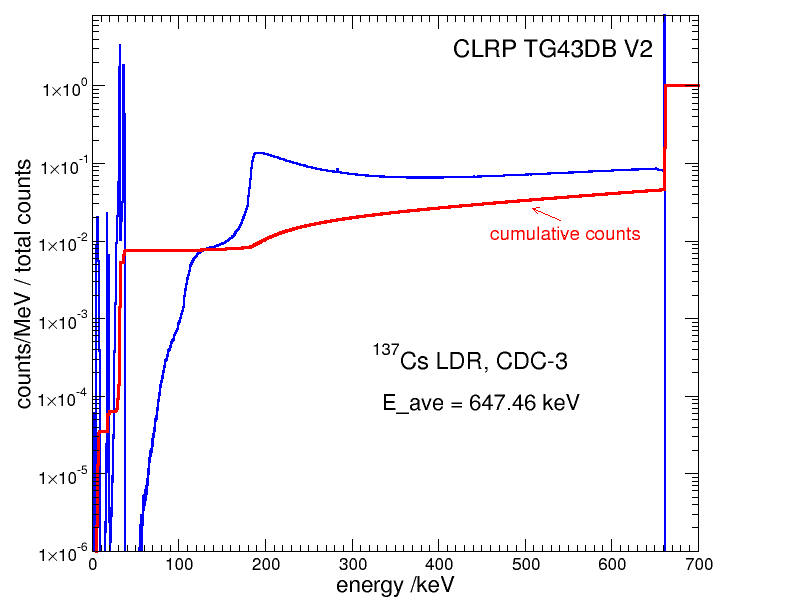
Photon energy spectrum on the source surface: xmgrace
Tabulated data:
Tabulated data are available in .xlsx format: Excel
References:
1. J. Pérez-Calatayud, et al , Dosimetric characteristics of the CDC-type miniature cylindrical 137Cs brachytherapy sources, Med Phys , 29 , 538-543, 2002
2. E. Casal et al , Monte Carlo calculations of dose rate distributions around the Amersham CDCS-M-type CS137 source, Med. Phys., 27 , 132 - 140, 2000
3. R. E. P. Taylor et al , Benchmarking BrachyDose: voxel-based EGSnrc Monte Carlo calculations of TG-43 dosimetry parameters, Med. Phys., 34 , 445 - 457, 2007
4. D. W. O. Rogers, Inverse square corrections for FACs and WAFACs, Appl. Radiat. Isot.,153 ,108638, 2019
5. H. Safigholi, M. J. P. Chamberland, R. E. P. Taylor, M. P. Martinov, D. W. O. Rogers, and R. M. Thomson, Update of the CLRP TG-43 parameter database for high-energy brachytherapy sources, to be published (Current calculation).