
Source Description:
Dimensions for the microSelectron v2 1,2,3,4 are taken from the study by Daskalov et al . The microSelectron consists of a 3.60 mm long 192 Ir core with a diameter of 0.65 mm enclosed in a 0.90 mm diameter AISI 316L stainless steel capsule (density 8.06 g/cm 3 ). The Ir core was modelled as a 3.48 mm long cylindrical section attached to two 0.265 mm long 45 o conical sections to approximate the rounded ends of the real source. The tip of the encapsulation is modelled as a 0.45 mm hemi-sphere with its center shifted 1.65 mm from the center of the source. The end of the encapsulation attached to the cable is modelled as a 0.15 mm thick conical section (half angle of 33.7 o ) starting 1.2 mm from the center of the source. Attached to the conical section is a 2 mm long section of AISI 316L stainless steel cable with a density of 4.81 g/cm 3 . The active length of this source is 3.60 mm.
Dose Rate Constant - Λ :
Dose rate constants, Λ , are calculated by dividing the dose to water per history in a (0.1 mm) 3 voxel centered on the reference position, (1 cm,Π/2), in the 80x80x80 cm 3 water phantom, by the air kerma strength per history. Calculations of the air kerma per history are scored in vacuo avoiding the need to correct for attenuation by air. The mass energy absorption coefficients for air used in this calculation are calculated with the composition recommended by TG-43U1 (40% humidity). Air kerma per history is calculated in a 10x10x0.05xcm 3 voxel located 100 cm from the source along the transverse axis and then corrected to give the air kerma per history at a point as described in our previous study 5 . Low energy photons emitted from the source encapsulation are suppressed in the air-kerma calculations by discarding all photons with energy less than 10 keV (i.e. PCUT set to 10 keV in EGSnrc).
| Author | Method | Λ (cGy h-1 U-1) | Abs. Uncertainty |
| R. E. P. Taylor, D. W. O. Rogers 6 | voxel at 100 cm | 1.109 | 0.002 |
| R. E. P. Taylor, D. W. O. Rogers 6 | r o = 0.2 cm / voxel at 100 cm | 22.73 | 0.02 |
| G. M. Daskalov et al 1 | extrap | 1.108 | 0.001 |
| Ruqing Wang, X. Allen Li 7 | r o = 0.2 cm / voxel at 100 cm | 22.75 | 0.03 |
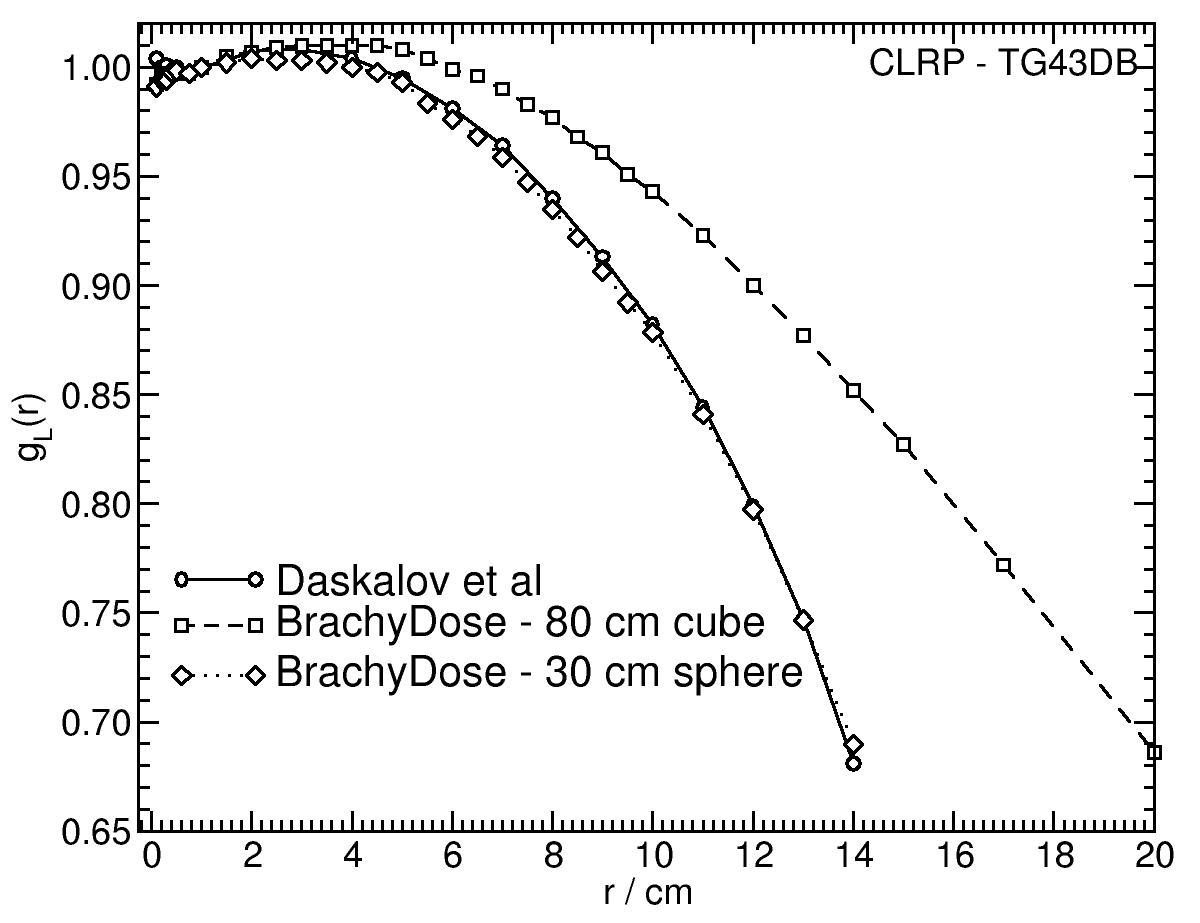
Radial dose function - g(r):
The radial dose function, g(r), is calculated using both line and point source geometry functions and tabulated at 36 different radial distances ranging from 0.2 cm to 20 cm. Fit parameters for a modified polynomial expression are also provided 8 .
| Fitting coefficients for g L (r) = (a 0 r -2 + a 1 r -1 +a 2 + a 3 r +a 4 r 2 + a 5 r 3 ) e -a 6 r | ||||||||
| Fit range | Coefficients | |||||||
| r min (cm) | r max (cm) | a 0 / cm 2 | a 1 / cm | a 2 | a 3 / cm -1 | a 4 / cm -2 | a 5 / cm -3 | a 6 / cm -1 |
| 0.20 | 20.00 | -8.2166E-04 | 6.3598E-03 | 9.8048E-01 | 1.3689E-01 | 6.4290E-03 | 1.9392E-04 | 1.2180E-01 |
| Fitting coefficients for g L (r) = a 0 + a 1 r +a 2 r 2 + a 3 r 3 +a 4 r 4 + a 5 r 5 | ||||||||
| Fit range | Coefficients | |||||||
| r min (cm) | r max (cm) | a 0 | a 1 / cm -1 | a 2 / cm -2 | a 3 / cm -3 | a 4 / cm -4 | a 5 / cm -5 | |
| 0.20 | 20.00 | 9.9261E-01 | 7.8168E-03 | -2.1387E-04 | -2.2267E-04 | 1.4463E-05 | -2.8518E-07 | |
Anisotropy function - F(r,θ):
Anisotropy functions are calculated using the line source approximation and tabulated at 12 radii from 0.25 cm to 20 cm and 47 unique polar angles with a minimum resolution of 5°. The anisotropy factor, φan (r), was calculated by integrating the solid angle weighted dose rate over 0°≤ ϑ ≤ 180°.
F(00.25,θ) 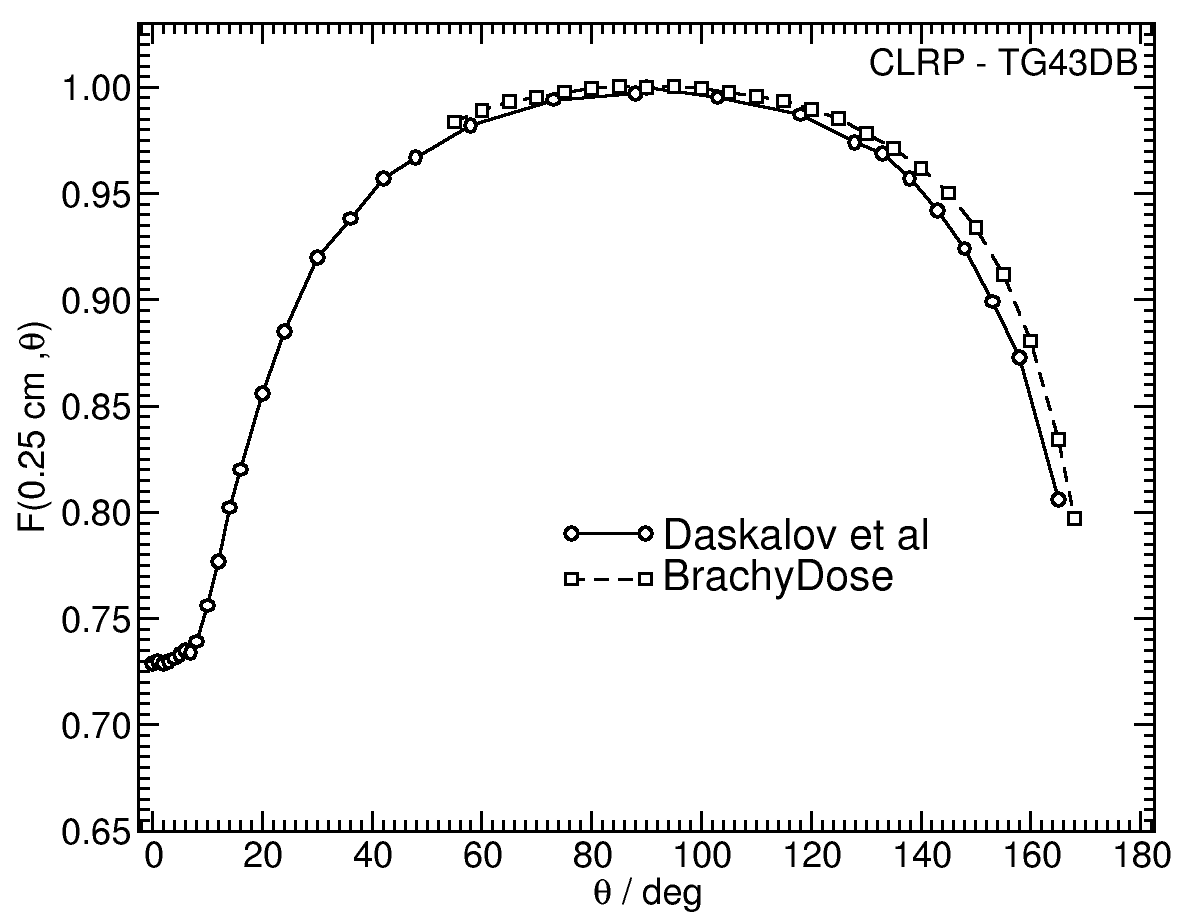 |
F(00.50,θ) 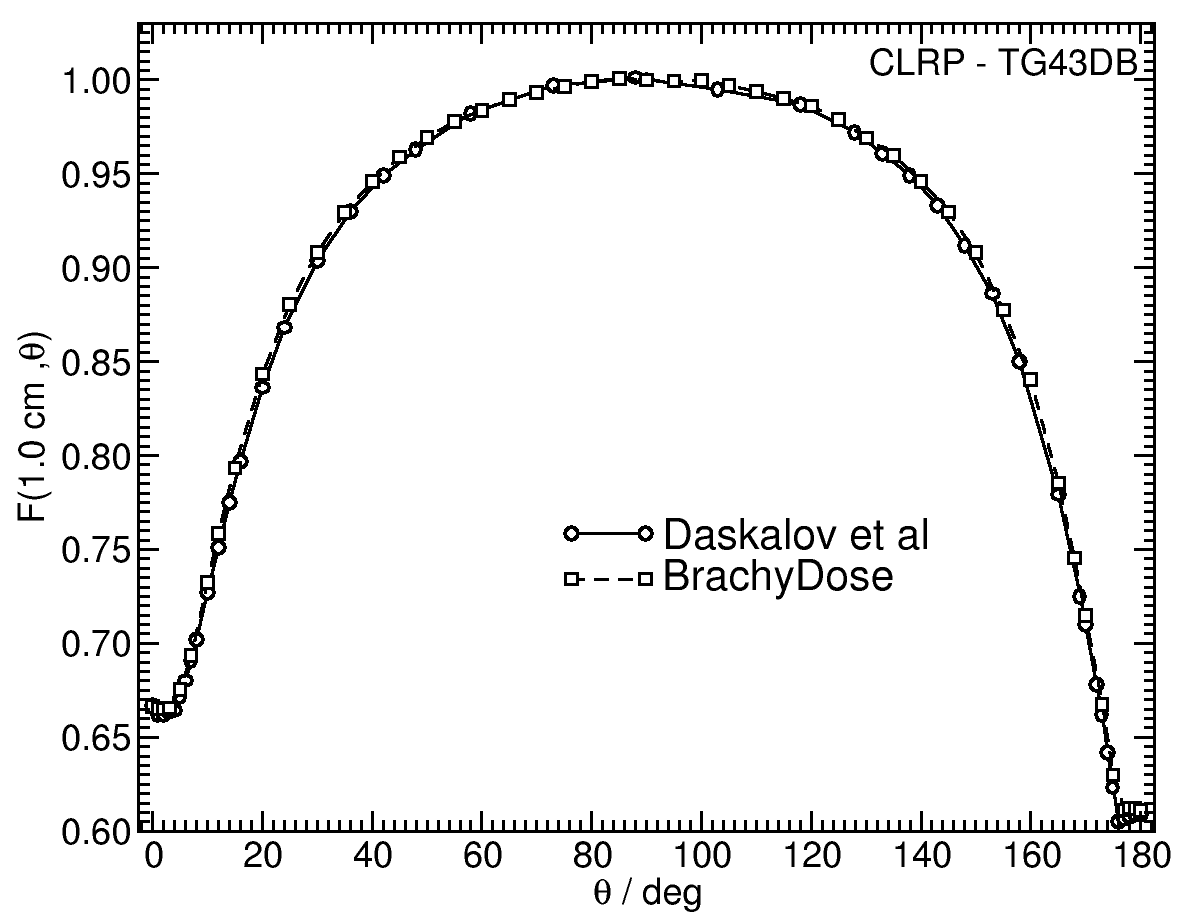 |
F(01.00,θ) 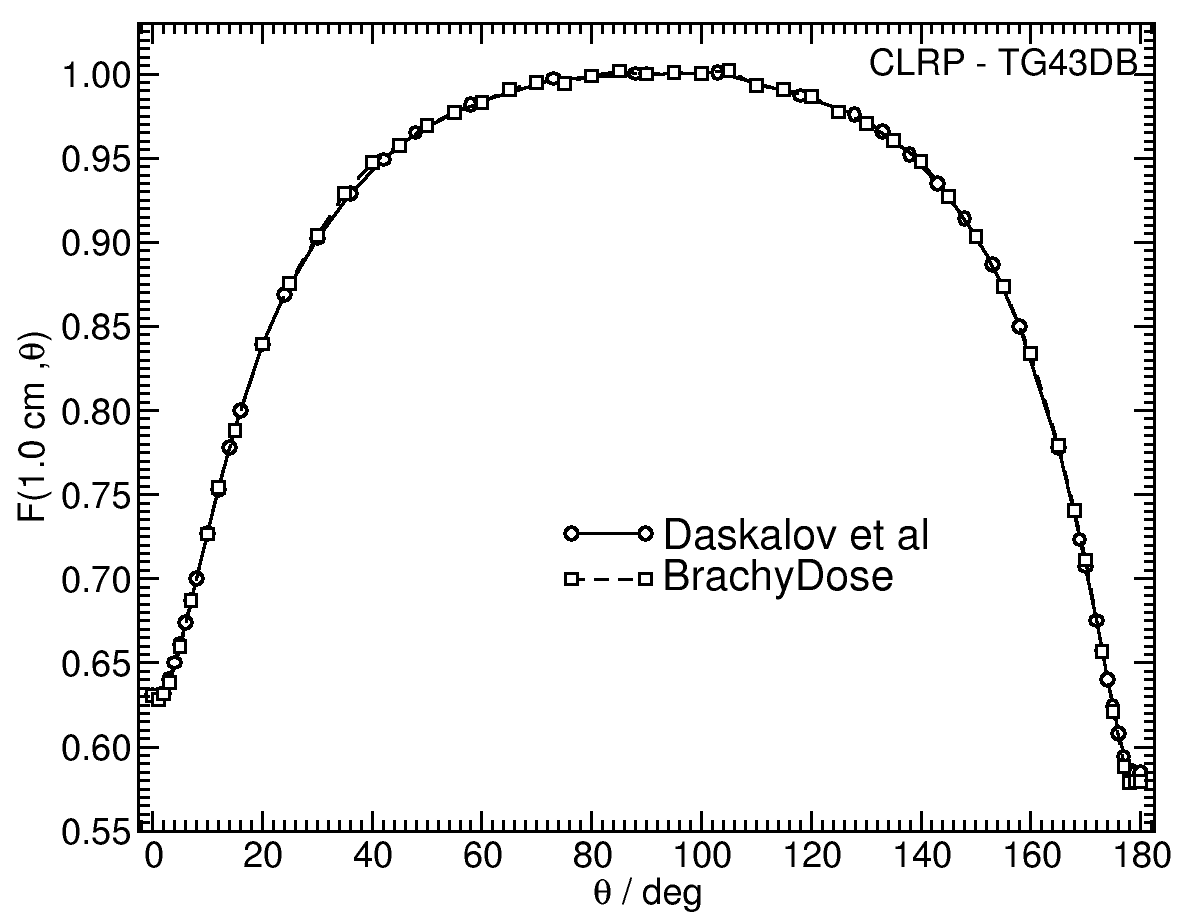 |
F(05.00,θ) 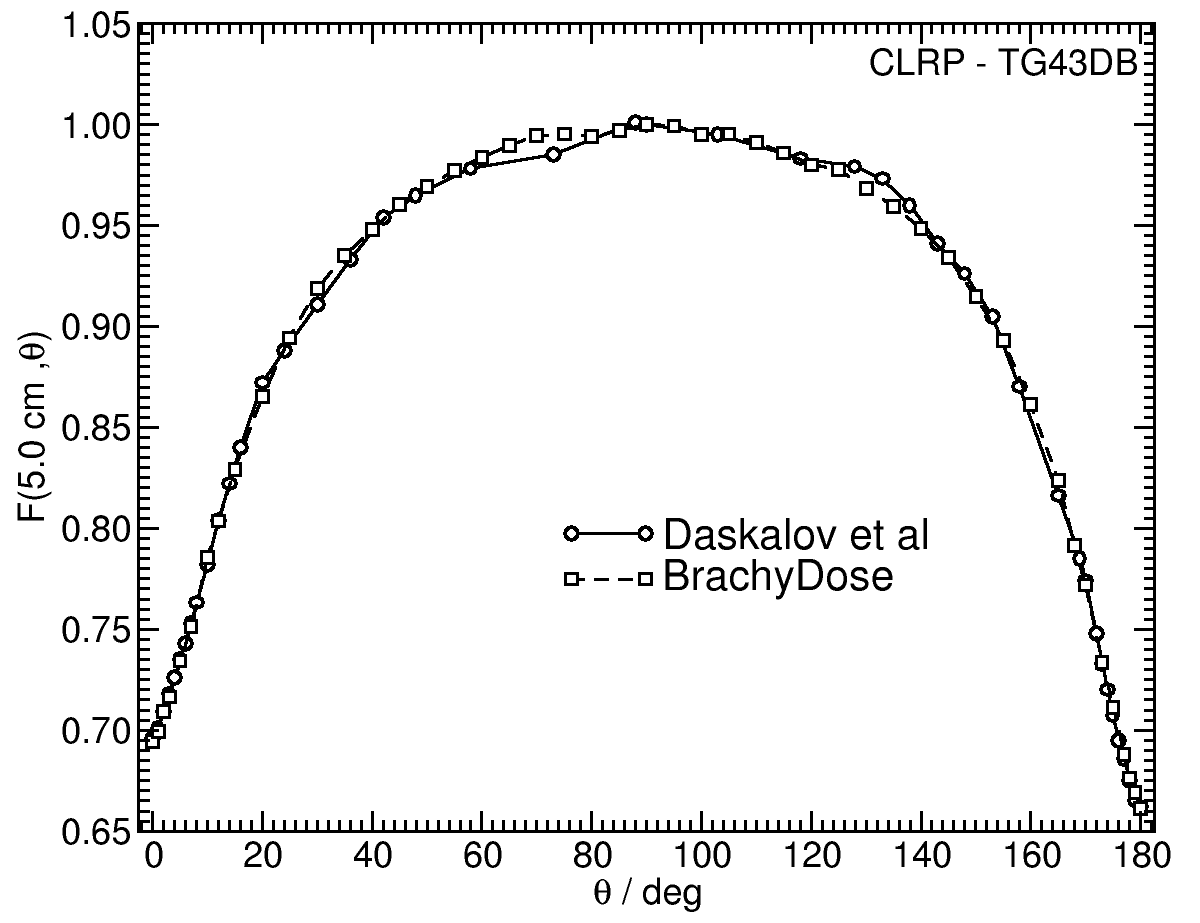 |
Along-Away Dose Data:
Along-away dose data are tabulated at 16 away distances from 0 cm to 20 cm and 31 along points from -20 cm to 20 cm. Doses are normalized to s k , the air kerma strength per history.
Primary and Scatter Separated (PSS) Dose Data: D ii (r,θ):
Primary and Scatter Separated (PSS) dose data are tabulated at 12 radii from 0.25 cm to 20 cm and 47 unique polar angles with a minimum resolution of 5°. High resolution (Δr = 1 mm, ΔΘ = 1°) primary scatter dose data are also available in .csv files. For the purposes of these calculations, scatter within the source is not considered and any photon escaping the source encapsulation is considered a primary. Only photons which scatter within the phantom are counted in the scatter tallies. Doses are normalized to the total photon energy escaping the encapsulation.
D ii (r,90°)*r 2 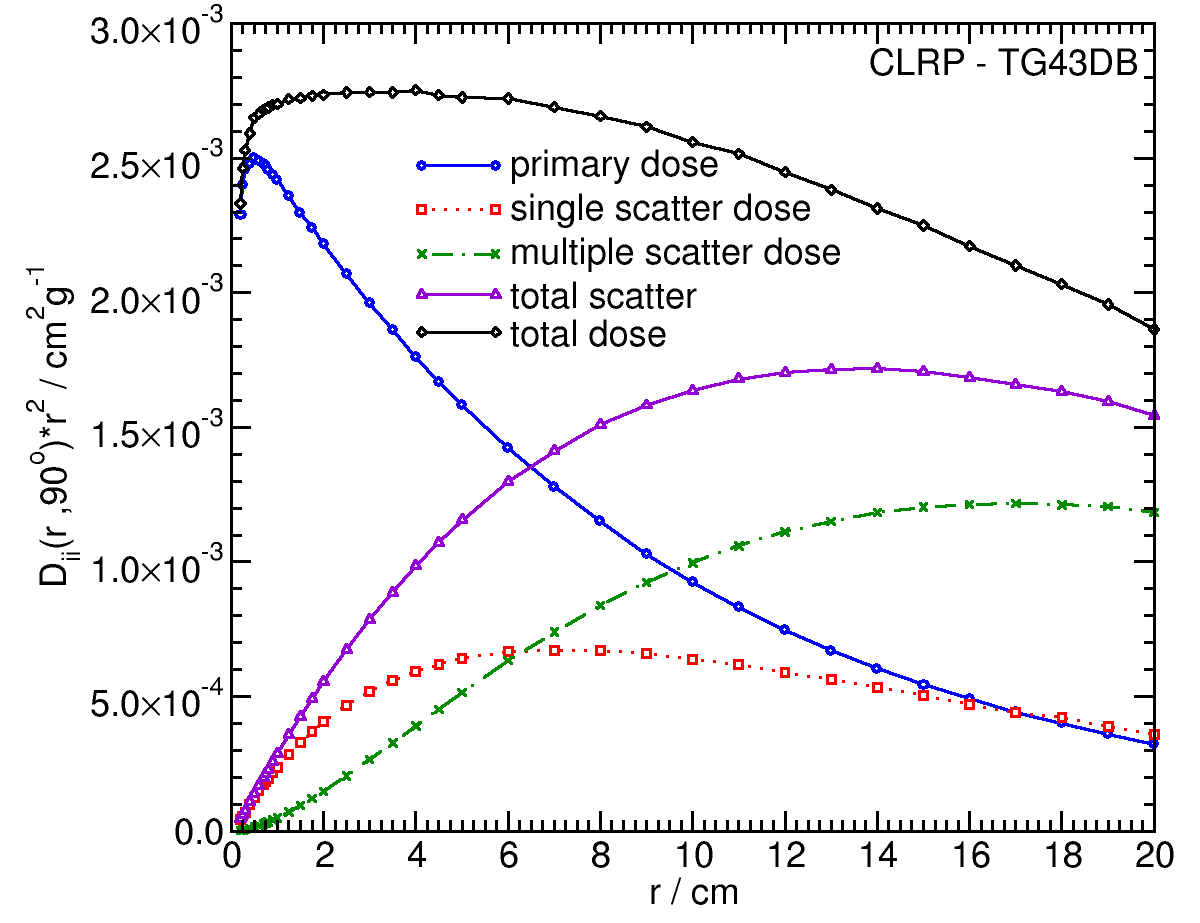 |
D ii (00.50,θ) 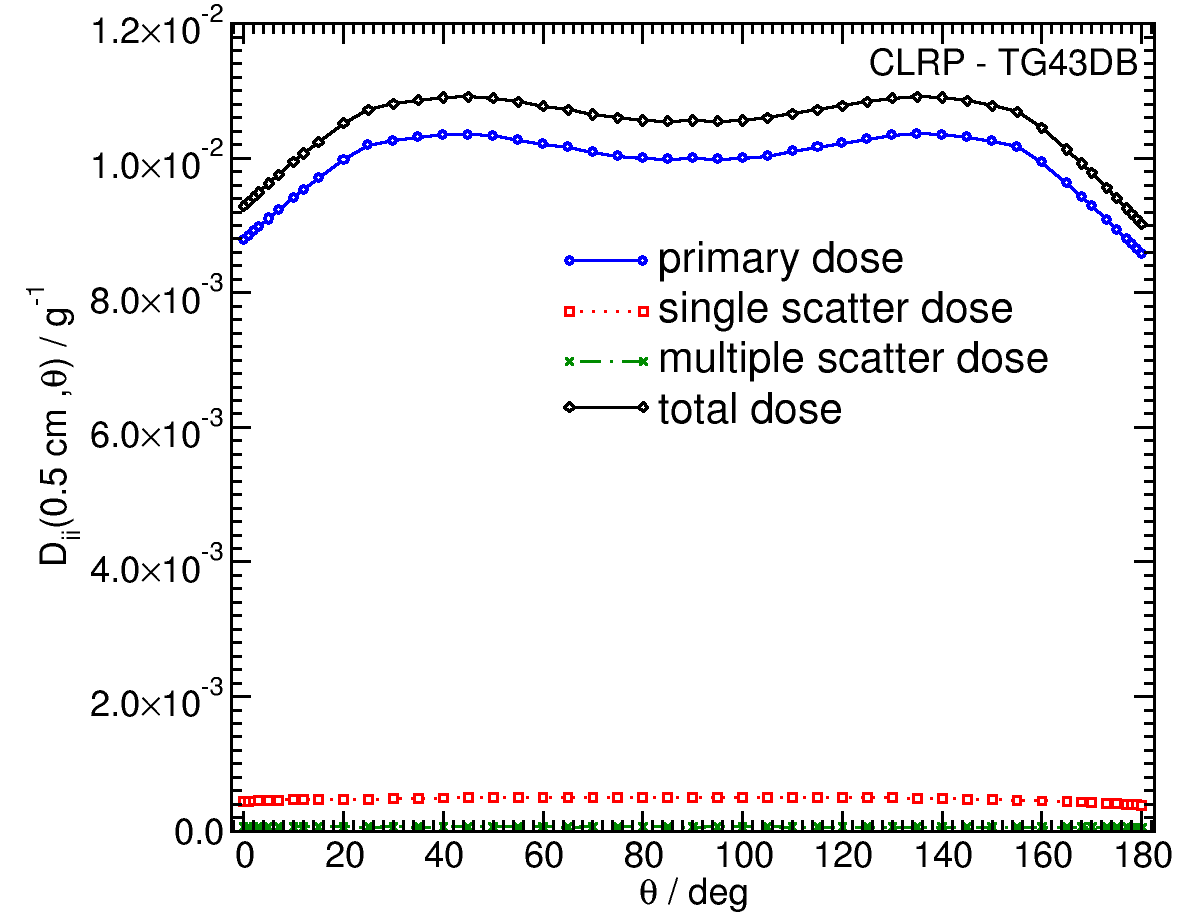 |
D ii (05.00,θ) 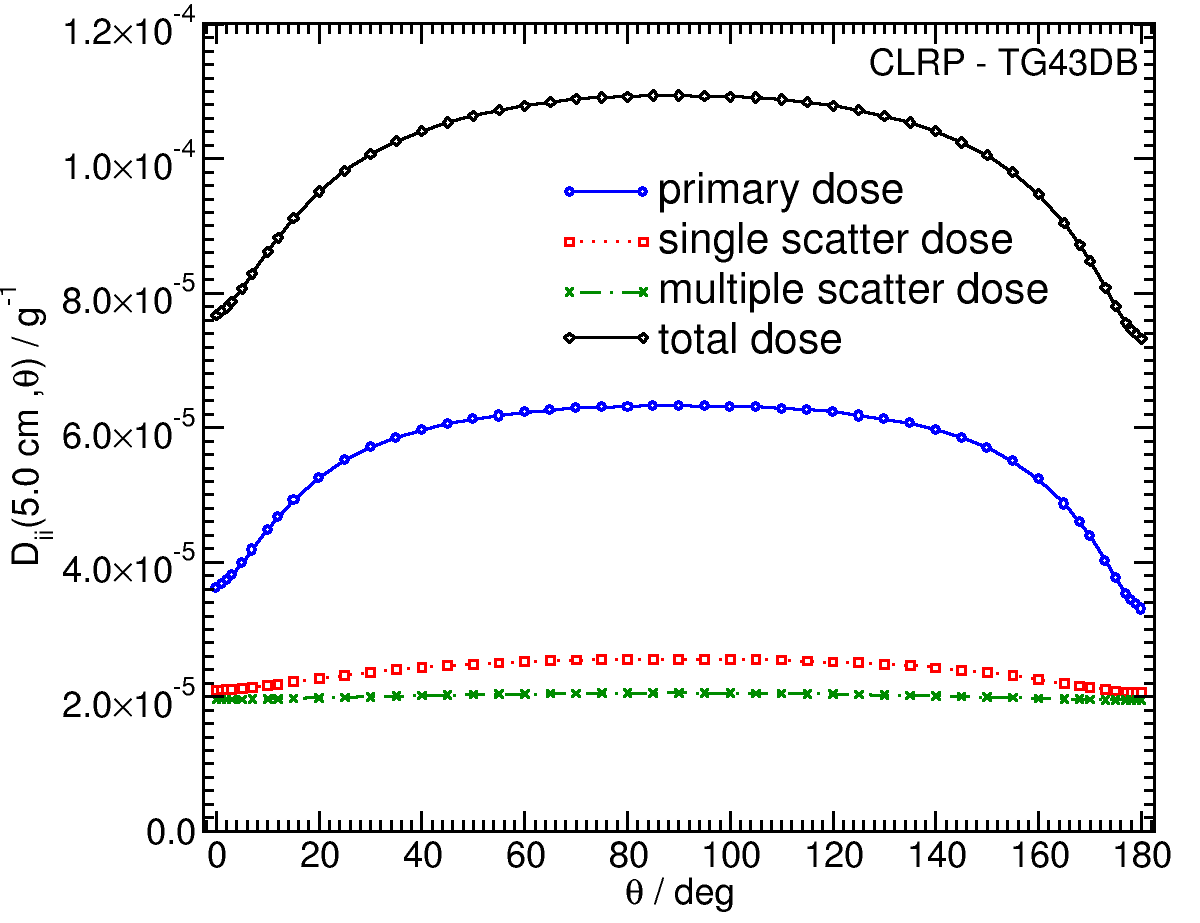 |
D ii (10.00,θ) 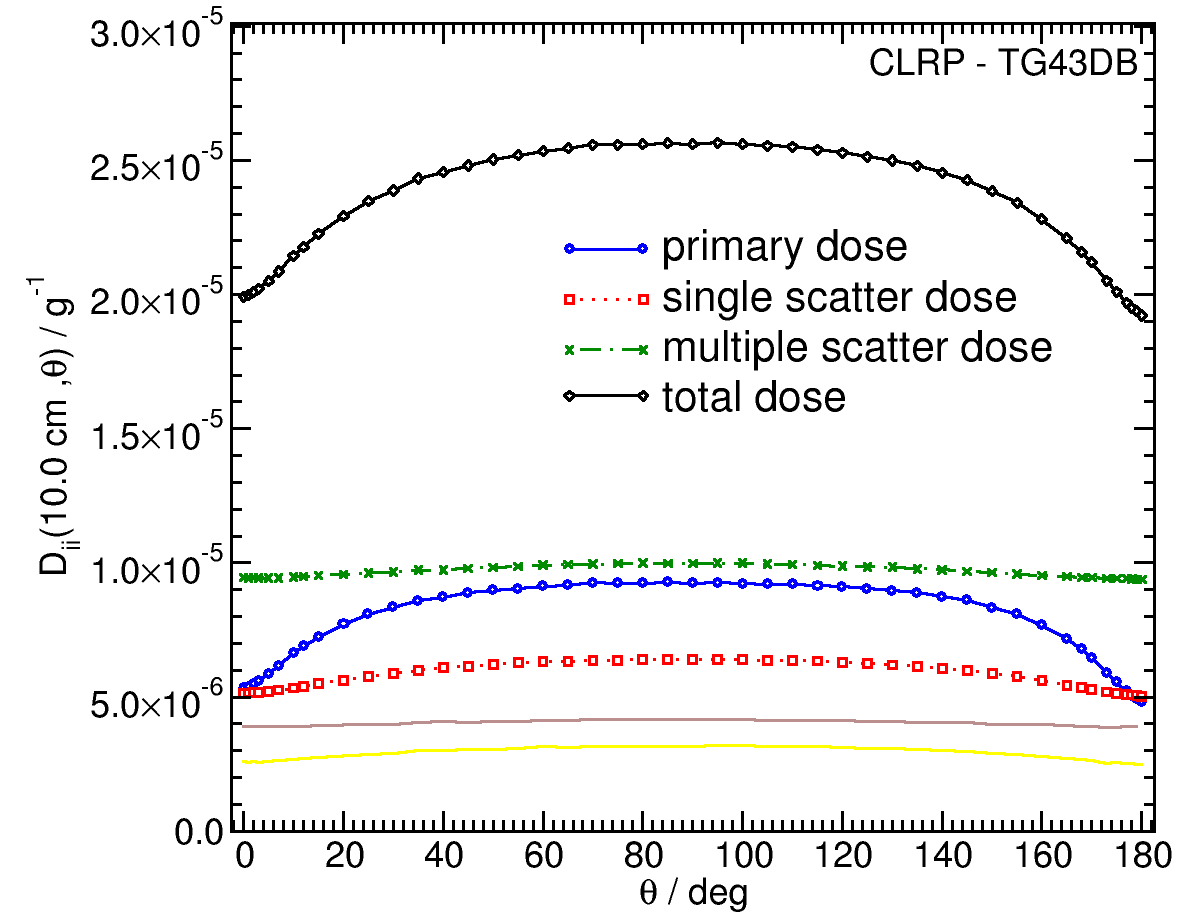 |
D ii (20.00,θ) 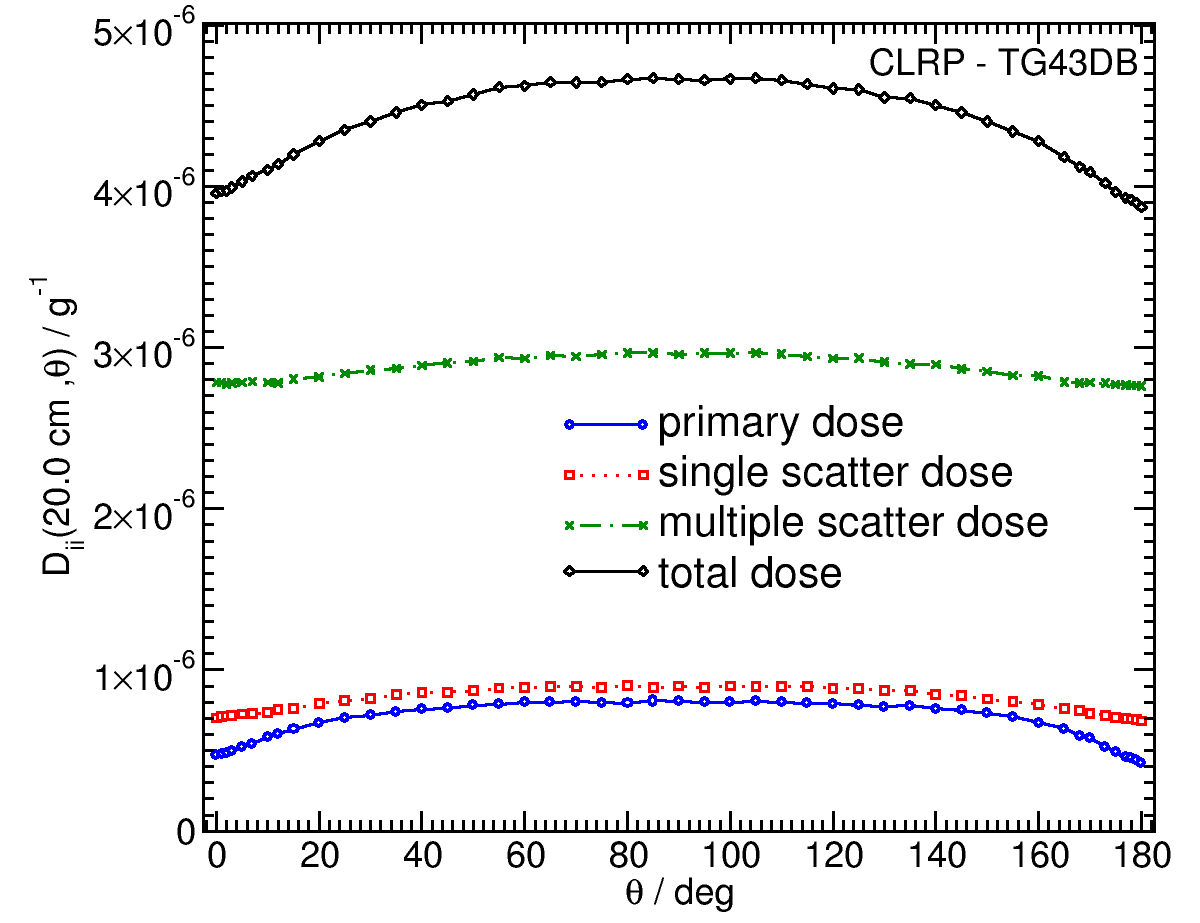 |
High resolution (1mm/1°) Tabulated D ii (r,θ) data in .csv format: Primary , Single Scat , Multiple Scat , Total
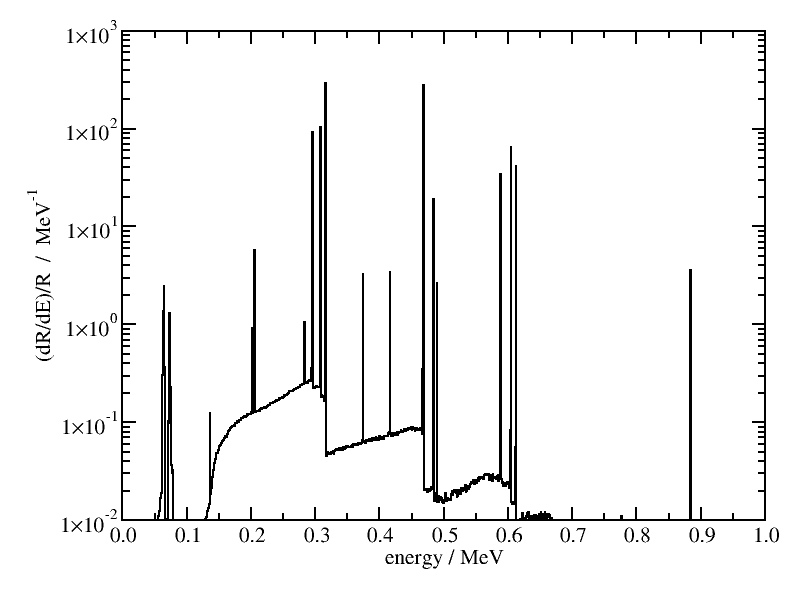
Energy Weighted Photon Spectrum, (dR/dE)/R
The energy weighted photon spectra are scored as:
where E j is the energy of the middle of a bin, E i is the energy of the i th photon escaping the encapsulation or cable with energies between Ej ±
ΔE/2 and ΔE is the bin width. Energy weighted photon spectra are normalized to the total radiant photon energy, R (total energy of photons escaping the encapsulation/cable) yielding uints of MeV -1 . The spectrum data is available in csv format below. The first line in the csv files contains the number of bins in the file (N), followed by the bin width of all the bins. The next N lines contain the energy of the center of the bin (E j ) followed by the value of (dR(E j )/dE)/R.
Energy weighted photon spectrum data: csv
References:
1. G. M. Daskalov et al , Monte Carlo-aided dosimetry of a new high dose-rate brachytherapy source, Med. Phys., 25 , 2200 -- 2208, 1998
2. G. M. Daskalov, Erratum: "Monte Carlo-aided dosimetry of a new high dose-rate brachytherapy source" [Med. Phys. 25, 2200-2208 (1998)], Med. Phys., 27 , 1999--1999, 2000
3. F. Lliso et al , Fitted dosimetric parameters of high dose-rate 192Ir sources according to the AAPM TG43 formalism, Med. Phys., 28 , 654--660, 2001
4. F. Lliso et al , Erratum: "Fitted dosimetric parameters of high dose-rate 192-Ir sources according to the AAPM TG43 formalism" [Med. Phys. 28(4), 654-660 (2001)], Med. Phys., 28 , 1964--1964, 2001
5. R. E. P. Taylor et al , Benchmarking BrachyDose: voxel-based EGSnrc Monte Carlo calculations of TG--43 dosimetry parameters, Med. Phys., 34 , 445 -- 457, 2007
6. R. E. P. Taylor, D. W. O. Rogers, EGSnrc Monte Carlo calculated dosimetry parameters for 192 Ir and 169 Yb brachytherapy sources, Med. Phys., 35 , 4933 -- 4944, 2008
7. Ruqing Wang, X. Allen Li, Dose characterization in the near-source region for two high dose rate brachytherapy sources, Med. Phys., 29 , 1678-1686, 2002
8. R. E. P. Taylor, D. W. O. Rogers, More accurate fitting of 125 I and 103 Pd radial dose functions, Med. Phys., 35 , 4242--4250, 2008
Carleton Laboratory for Radiotherapy Physics
August 29 2008.